
Manufacturing at a glance
Ten facts that frame the manufacturing industry.
Ten facts that frame the manufacturing industry.
Output is large, labor is scarce, productivity is flat and robot adoption is rising fast, led by China.
U.S. output is large
Factories add $3.0T of value, about 9.5% of GDP (2026), and shipped $7.2T of goods in 2025.
Labor is scarce
584,000 jobs sat open in Sep 2026; payrolls of 12.65M are well below 19.6M in 1979.
Labor is costly
Pay and benefits average $48.62 per hour worked (June 2026), a third of it benefits.
The U.S. trails in robots
U.S. installed 38,400 robots in 2025 vs 354,000 in China; density 307 vs Korea's 1,220.
Factory building peaked
Factory construction hit $235.6B in 2024; the Sep 2026 annual rate is about $170B.
China leads the world
World manufacturing value added is $16.6T (2024); China makes about 28%, the U.S. roughly a sixth.
The gap will widen
Up to 3.8M new workers are needed by 2033; about 1.9M of those jobs may go unfilled.
Robot demand is high
Factories installed 603,000 robots in 2025, a record and more than double a decade ago; the global stock passed 5 million.
Reshoring is under way
247,000 jobs were announced via reshoring and foreign investment in 2025; 2.3M since 2010.
Productivity is flat
Output per hour rose 0.4% a year from late 2019 to Q3 2025, vs 2.1% a year since 1987.
Source: NAM; BEA; BLS; Census; Deloitte and Manufacturing Institute; IFR World Robotics 2025; Reshoring Initiative; World Bank.
Foundations
What manufacturing is, how it evolved, and how a factory is measured.
Manufacturing turns inputs into finished, saleable goods.
A factory is a system that adds value to materials with labor, machines, energy and information.
- Raw materials
- Metals, resins, crops
- Finished goods
- Cars, devices, food, drugs
- Parts and components
- Bought from suppliers
- Fabricate
- Cut, form, mold, cast, mix
- Assemble
- Join parts into products
- Components
- Sold to other makers
- Labor and skills
- Operators and engineers
- Finish
- Coat, treat, package
- Inspect and test
- Verify against the spec
- Scrap and waste
- Reworked, recycled or lost
- Energy and utilities
- Power, air, water, heat
- Move and store
- Material flow between steps
- Capital and designs
- Equipment and designs
- Data
- Quality and output records
Value added is what a plant creates beyond the cost of the materials it buys.
U.S. manufacturing is a $3T engine for jobs, exports and R&D.
Factories are a small share of employment but a large share of trade, innovation and pay.
$3.0T of value added
About 9.5% of U.S. GDP in 2026, and roughly $7.2T of goods shipped in 2025.
239,000 manufacturers
Firms of every size make products in the U.S., from small job shops to global OEMs.
12.7M workers
Manufacturing employed 12.65M people in September 2026.
$1.7T of exports
U.S. manufactured goods exported in 2025.
52% of private R&D
Manufacturers perform just over half of all research and development by U.S. businesses.
Above-average pay
NAM reports average annual earnings of $106,691 for manufacturing employees.
What factories make, and how well, shapes national output, trade and wages.
Source: NAM; BEA; BLS (Sep 2026); Census Bureau (2025).
Four industrial revolutions moved factories from hands to data.
Each wave changed the main source of power, the way work is organized and the skills a plant needs.
1. Mechanization
2. Mass production
3. Automation
4. Connected factories
From about 1760: steam and water power move work from hand tools to machines.
From about 1870: electricity, the moving assembly line and interchangeable parts.
From about 1970: computers, PLCs and industrial robots take over repetitive tasks.
From 2011: sensors, networks, cloud and AI link machines, plants and suppliers.
1913
Ford moving assembly line
1961
First Unimate robot at GM
1969
First PLC (Modicon 084)
2011
Industry 4.0 term introduced
Physical AI is the next step: machines that sense, decide and move in real plants.
Source: Hannover Messe (2011); industry histories of Ford, GM and Modicon.
A product moves through six stages from order to customer.
Every stage can be planned, measured and, in many cases, automated or supported by robots.
Order and design
Customer demand, product design, bill of materials and routing.
Plan and source
Production schedule, purchasing and supplier deliveries.
Fabricate
Machine, mold, cast, stamp or mix raw materials into parts.
Assemble
Join parts and subassemblies into the finished product.
Test and inspect
Check dimensions, function and safety against the spec.
Pack and ship
Package, label, palletize, store and deliver to the customer.
Bottlenecks and waiting between stages usually cost more than the work inside them.
Every factory runs on four building blocks.
Whatever the product, a plant needs the same four things working together.
Site and utilities
The building and what feeds it
- Floor space, loading docks, structure
- Electric power and backup supply
- Compressed air, water and HVAC
- Drainage, waste and safety systems
Equipment and tooling
The machines that make the product
- Process machines: CNC, presses, molders
- Robots, conveyors and material handling
- Tooling, fixtures, gauges and test rigs
- Maintenance spares and service access
Materials and parts
What gets turned into product
- Raw materials and purchased components
- Receiving, storage and inventory control
- Supplier quality and on-time delivery
- Packaging and outbound logistics
People and information
Who runs it and what they know
- Operators, technicians and engineers
- Supervisors, quality and safety staff
- Work instructions, schedules and records
- ERP, MES and machine data systems
A weak link in any one block limits the output of the other three.
Volume and variety decide how a plant is organized.
Four production modes run from one-off jobs to nonstop flow; products are either discrete or process.
| Type | How it works | Volume and variety | Examples | Automation fit |
|---|---|---|---|---|
| Job shop | One-off or very small orders, custom work | Low volume, very high variety | Prototypes, tooling, aerospace parts | Flexible: cobots, CNC cells |
| Batch | Groups of identical items, then changeover | Medium volume, medium variety | Bakery, apparel, specialty chemicals | Programmable cells, quick change |
| Mass (repetitive) | Fixed line making the same item repeatedly | High volume, low variety | Cars, appliances, phones | Dedicated lines, many robots |
| Continuous | Nonstop flow that is not stopped between orders | Very high volume, no variety | Refining, steel, paper, glass | Process control, few robots |
| Discrete products | Countable items that can be taken apart | Mixed | Cars, electronics, machinery | Arms, AMRs, vision |
| Process products | Mixed or reacted materials, not countable | Mixed | Food, chemicals, drugs, plastics | Control systems, packaging robots |
Robots fit discrete work most easily; process plants use them mainly at the packing end.
Factories scale from one workcell up to a megafactory.
The same building blocks repeat at five levels; automation choices change with each.
Megafactory or campus Site
Multi-building site, often built in phases
Why scale matters
- A cell is the usual first robot project: small, fast to test.
- Lines add balance and buffers between stations.
- Plants share utilities, logistics and maintenance.
- Megafactories need phased builds and long-lead equipment.
Plant Building
One building with several lines and shared services
Production line Flow
Linked stations that make one product family
Workcell Cell
A robot or machine with fixtures, guarding and controls
Station or machine Unit
One tool doing one operation
Proving one cell first lowers risk before the same design is copied across a line or plant.
OEE, throughput and yield show how well a plant runs.
Overall equipment effectiveness (OEE) multiplies availability, performance and quality into one score.
| Measure | What it tells you | How it is calculated | Reference point |
|---|---|---|---|
| OEE | Share of planned time making good parts at full speed | Availability x performance x quality | World class 85%; typical about 60% |
| Availability | How much planned time the machine actually runs | Run time / planned production time | World class about 90% |
| Performance | How close actual speed is to the ideal rate | Actual rate / ideal rate | World class about 95% |
| Quality (yield) | Share of units that are good the first time | Good units / total units started | World class about 99% |
| Throughput | Good units produced per hour, shift or day | Units out / time | Set by the slowest step |
| Cycle time and takt time | Time per unit, versus time allowed by demand | Cycle: step duration; takt: time / demand | Cycle must stay below takt |
A plant at 60% OEE can add output by recovering lost time before it buys new machines.
Source: OEE.com (world-class benchmark of 85%; typical about 60%); Nakajima, TPM.
Market and industry
How big manufacturing is, who leads it, and what is reshaping the U.S. factory map.
World factories add $16.6T a year, 2.7 times the 2000 level.
Value added counts what factories add to their inputs; trade counts goods crossing borders.
$16.6T
World manufacturing value added, 2024
2.7x
Growth in value added since 2000 ($6.3T)
14.9%
Manufacturing share of world GDP, 2024
$15.9T
World trade in manufactured goods, 2024
28%
China's share of world value added, 2024
How to read the numbers
- Value added is sales minus bought-in inputs, so it avoids double counting.
- China's value added rose from $1.9T in 2010 to $4.7T in 2024.
- The U.S. share of world manufactured goods trade was 7.8% in 2024.
- Figures are in current U.S. dollars, so currency moves shift the ranking.
Manufacturing is a $16.6T global activity, and two countries produce nearly half of it.
Source: World Bank WDI, NV.IND.MANF (2024); NAM Facts About Manufacturing (2026).
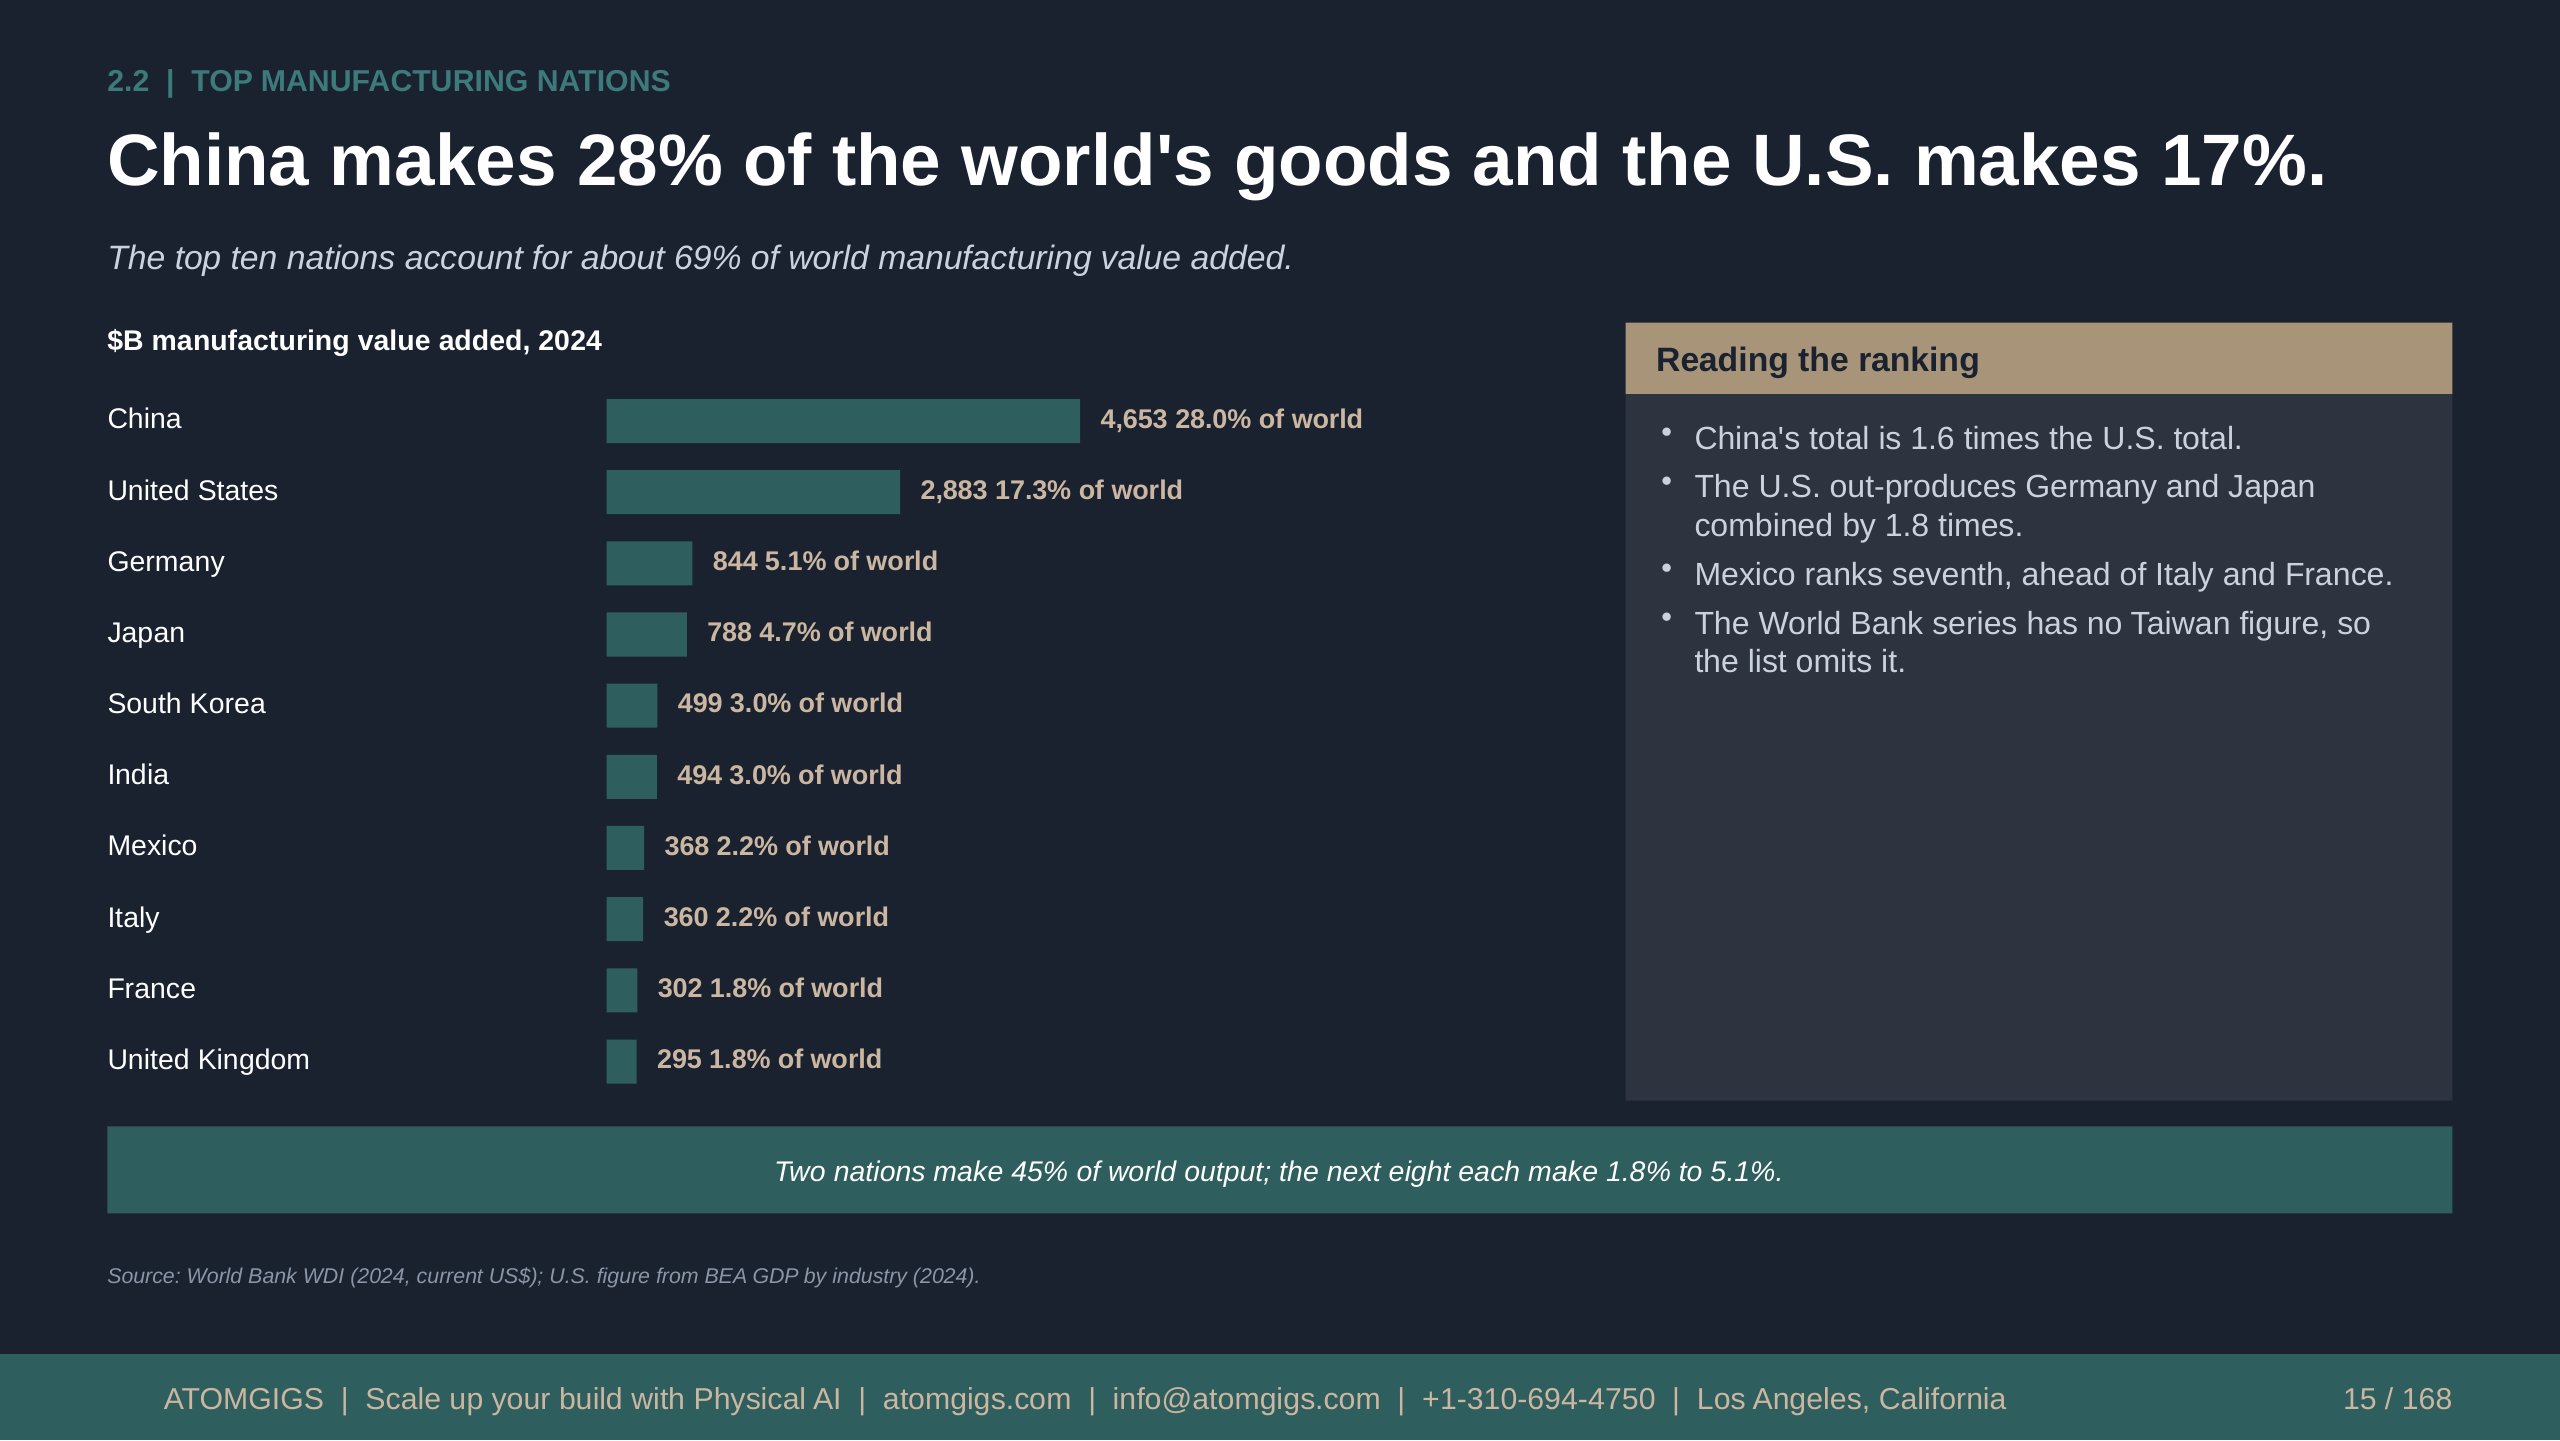
China makes 28% of the world's goods and the U.S. makes 17%.
The top ten nations account for about 69% of world manufacturing value added.
Text version
$B manufacturing value added, 2024
Reading the ranking
China
4,653 28.0% of world
- China's total is 1.6 times the U.S. total.
- The U.S. out-produces Germany and Japan combined by 1.8 times.
- Mexico ranks seventh, ahead of Italy and France.
- The World Bank series has no Taiwan figure, so the list omits it.
United States
2,883 17.3% of world
Germany
844 5.1% of world
Japan
788 4.7% of world
South Korea
499 3.0% of world
India
494 3.0% of world
Mexico
368 2.2% of world
Italy
360 2.2% of world
France
302 1.8% of world
United Kingdom
295 1.8% of world
Two nations make 45% of world output; the next eight each make 1.8% to 5.1%.
Source: World Bank WDI (2024, current US$); U.S. figure from BEA GDP by industry (2024).
U.S. manufacturing is a $3T sector with 12.7M workers.
Employment is about a third below the 1979 peak of 19.4M; value added is $3.2T.
$3.2T
Value added, Q2 2026 (annual rate)
9.7%
Share of U.S. value added, Q2 2026
12.7M
Manufacturing jobs, Sep 2026
$1.76T
Goods exports, 2025 (a record)
$112K
Average pay and benefits, 2025
Structure
Why it matters
- 239,265 firms in 2022; 93.1% have fewer than 100 employees.
- 59.1% of workers are at firms with 500 or more employees.
- Durable goods hold 7.90M jobs; nondurable goods hold 4.75M (Sep 2026).
- Factories ran at 75.9% of capacity in Sep 2026.
- Each $1 of factory spending creates $2.69 of total activity (2024).
- Each factory job supports about 5 jobs across the economy.
- Manufacturers do 50.1% of private R&D: $431B in 2025.
- Industry uses 33.3% of all U.S. energy (2024).
Most firms are small shops, but most workers are employed by large companies.
Source: BEA and NAM (Q2 2026); BLS CES (Sep 2026); Federal Reserve G.17 (Sep 2026).
Chemicals, vehicles, food and electronics lead U.S. output.
Output is value added in 2025; jobs are Sep 2026 payroll counts.
| Sector | Output 2025 | Jobs Sep 2026 | What it makes |
|---|---|---|---|
| Chemicals (incl. pharma) | $579B | 906K | Drugs, resins, paints, fertilizer, industrial gases |
| Transportation equipment | $387B | 1.77M | Cars, trucks, parts, aircraft, ships, rail cars |
| Food, beverage, tobacco | $384B | 1.77M (food) | Meat, dairy, baked goods, drinks |
| Computer and electronics | $315B | 1.00M | Chips, instruments, computers, devices |
| Machinery | $220B | 1.10M | Industrial, farm and construction machines |
| Fabricated metal products | $199B | 1.46M | Machined parts, stampings, tanks, tools |
| Plastics and rubber | $94B | 695K | Molded parts, tires, packaging |
| All manufacturing | $2.9T | 12.65M | Durable 7.90M jobs; nondurable 4.75M jobs |
Chemicals lead on output; transportation equipment and food lead on jobs.
Source: BEA GDP by industry via FRED (2025); BLS Current Employment Statistics (Sep 2026).
Four forces are pulling new orders into U.S. plants.
Each driver favors different sectors and different kinds of automation.
Trade policy
Tariffs raise the cost of imports
- Section 232: 50% on steel, aluminum, copper; 25% on autos and parts.
- Tariffs ranked first among reshoring reasons since Jan 2025.
- Average U.S. tariff rate was 12.1% in Jul 2026.
Chips and AI hardware
Computers and electronics lead
- Chip projects total over $630B across 140 sites (SIA, Dec 2025).
- TSMC plans $165B in Arizona: six fabs and two packaging plants.
- Computer and electronics imports rose 29% in 2025.
Defense and aerospace
Government as the customer
- Anduril is building Arsenal-1 near Columbus, Ohio: about $1B.
- Anduril reported about $2B of revenue in 2025.
- California has 95,900 aerospace parts jobs (Sep 2026).
Health and security
Pharma and critical goods
- 100% tariff on branded drugs since Oct 2025; U.S. plant builders exempt.
- Pharma is 37% of manufacturing R&D: $160.6B in 2025.
- Federal capacity-building lifted reshored pharma jobs in 2025.
Policy, AI hardware, defense and health each add demand that existing plants cannot absorb.
Source: Reshoring Initiative (2026); SIA (2025); Kearney (2026); NAM (2026); company releases.
Announcements are strong, but factory construction is falling.
Reshoring headlines run ahead of output: building, staffing and ramping a plant takes years.
247K
Reshoring and FDI jobs announced, 2025
2.3M
Jobs announced since 2010
<10%
China share of U.S. mfg imports, 2025
-32%
Factory construction vs Sep 2024 peak
36%
OEMs reshoring or engaged (2026 survey)
What is moving
What is not
- China fell from about 20% to under 10% of U.S. manufacturing imports in four years.
- Other Asian low-cost countries gained $193B; Mexico gained $47B (+8%).
- Transportation equipment led announced jobs; technology led announced investment.
- The Reshoring Initiative expects about 309,000 announced jobs in 2026.
- Investment roughly tripled in four years; capacity grew only 1.5%.
- Factory construction spending is $170B a year, down from $250B in Sep 2024.
- Factory employment is 12.65M, below 12.90M in Jan 2023.
- Tariffs, geopolitical risk and proximity to customers drive the moves.
Plants are announced faster than they are built, staffed and brought to full output.
Source: Reshoring Initiative (2026); Kearney Reshoring Index (2026); Census via FRED (Sep 2026).
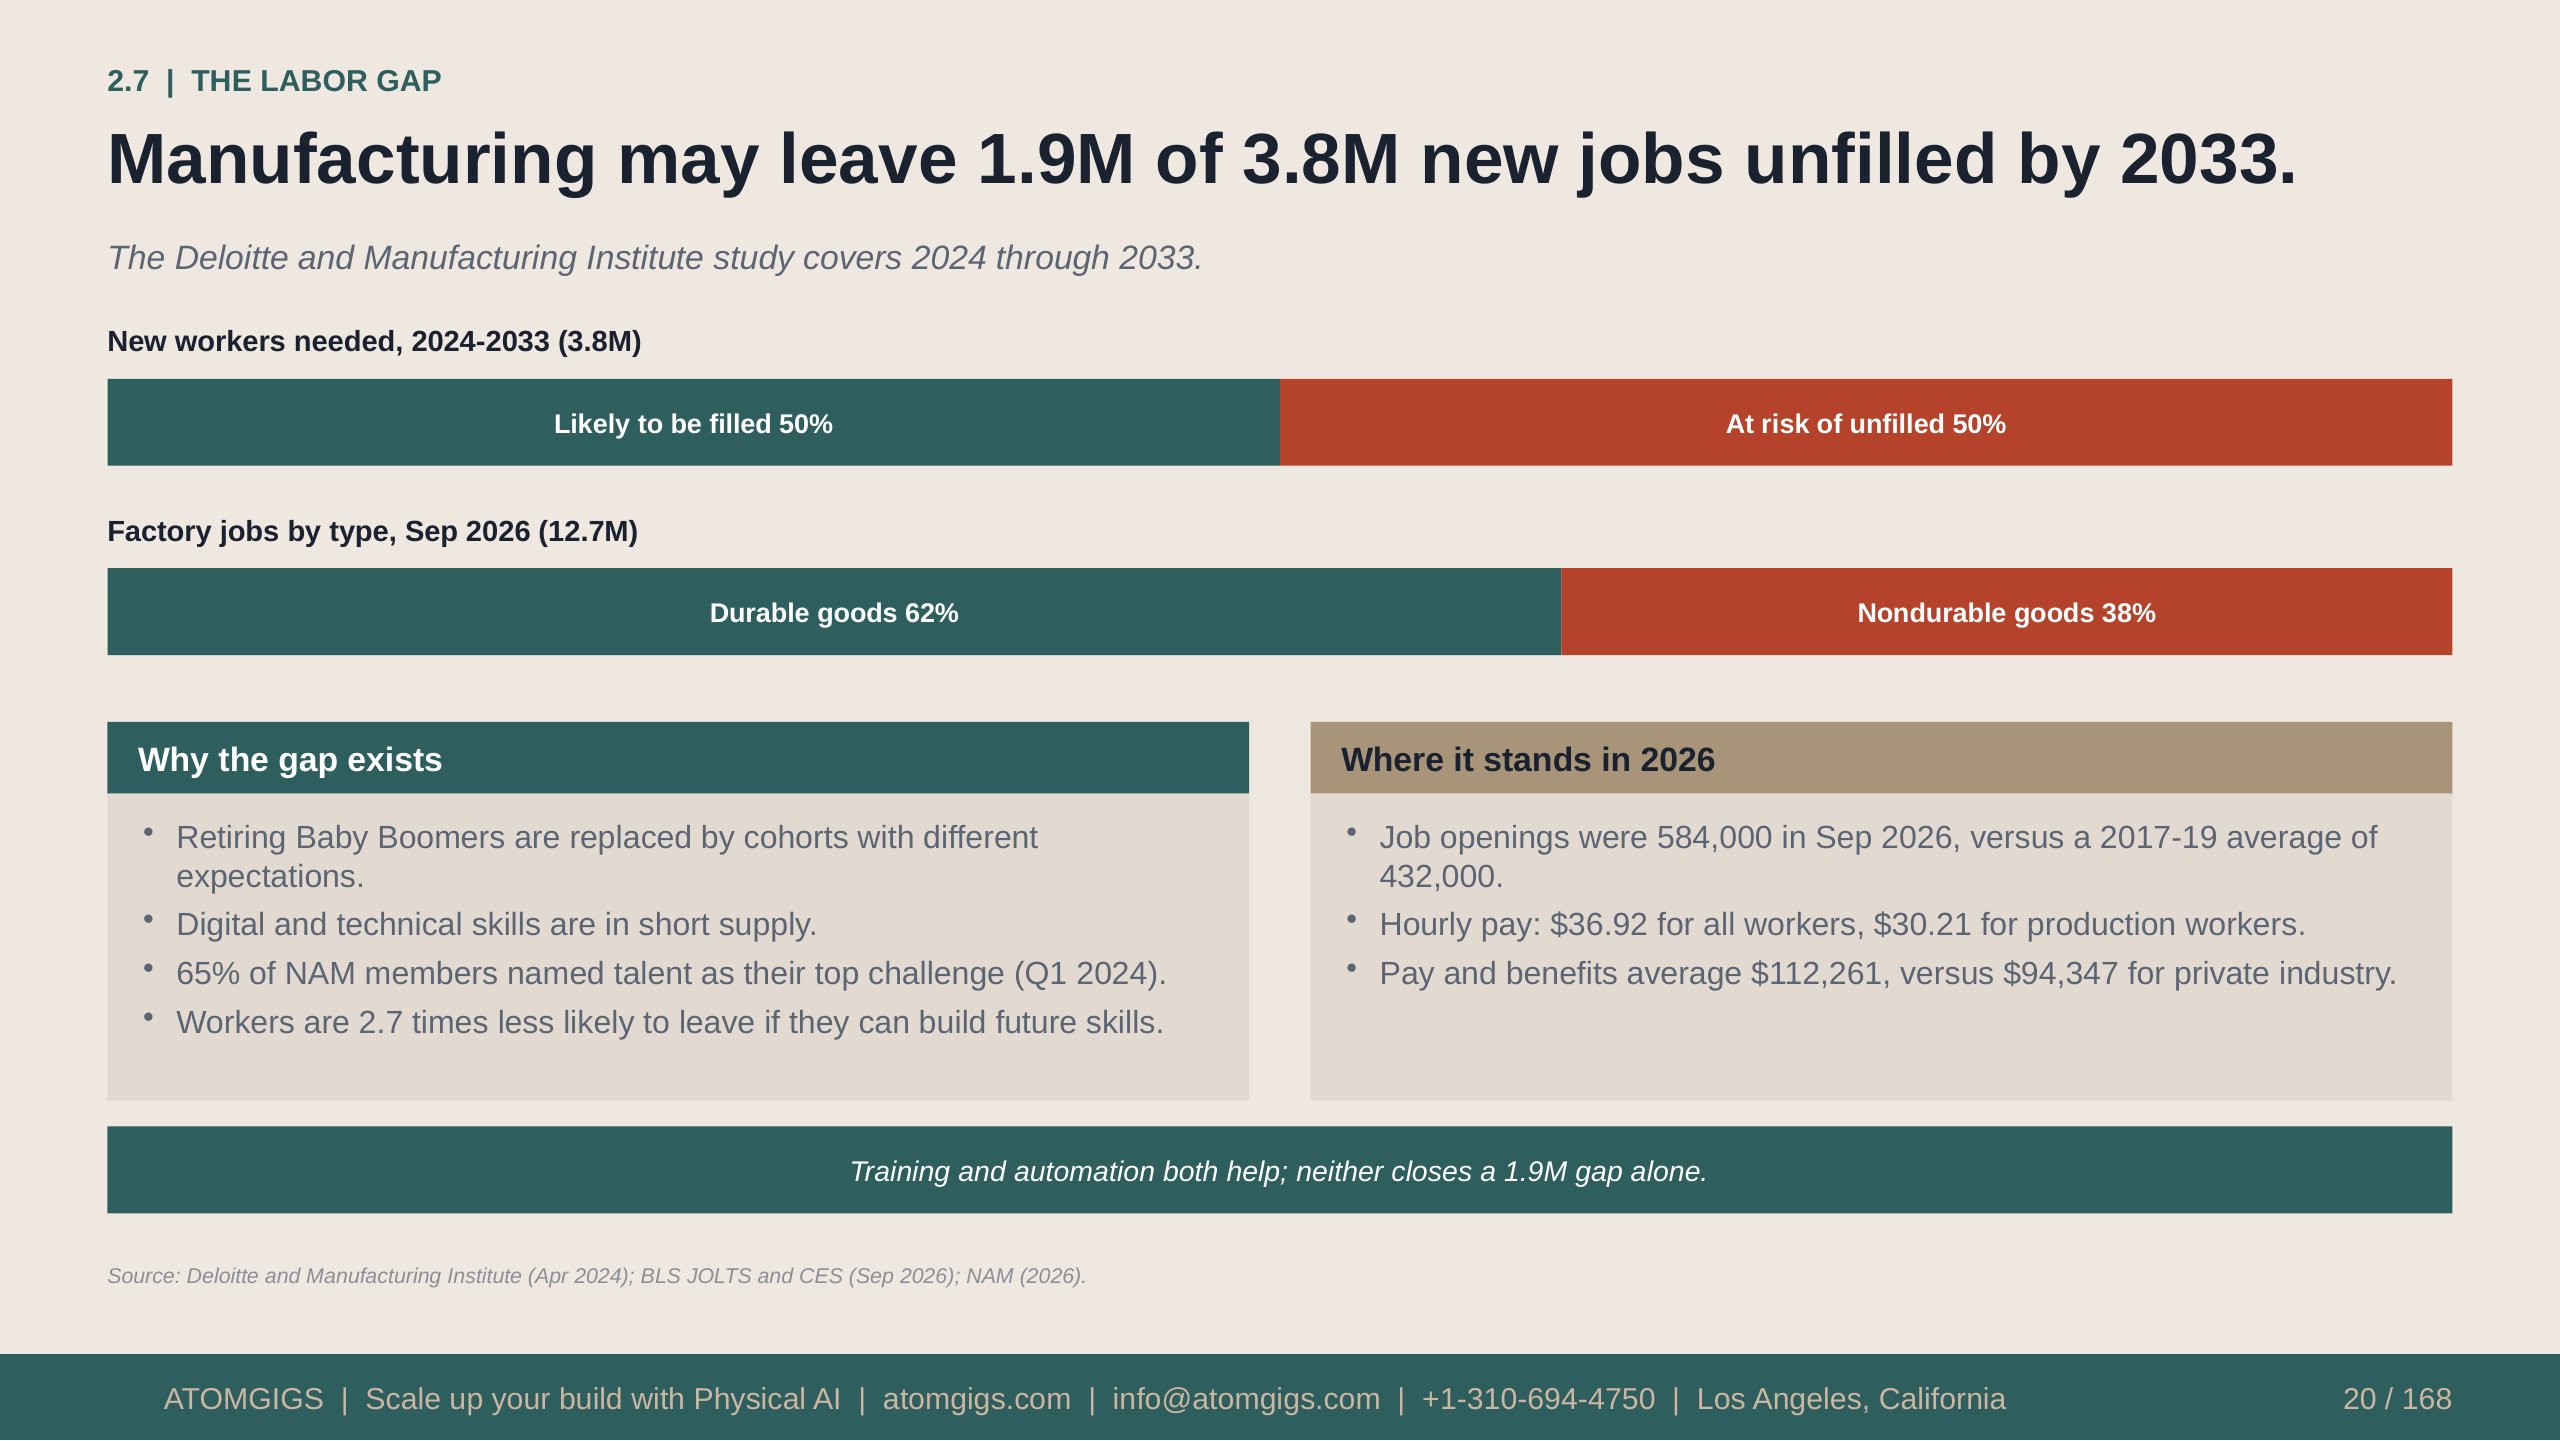
Manufacturing may leave 1.9M of 3.8M new jobs unfilled by 2033.
The Deloitte and Manufacturing Institute study covers 2024 through 2033.
Text version
New workers needed, 2024-2033 (3.8M)
Likely to be filled 50%
At risk of unfilled 50%
Factory jobs by type, Sep 2026 (12.7M)
Durable goods 62%
Nondurable goods 38%
Why the gap exists
Where it stands in 2026
- Retiring Baby Boomers are replaced by cohorts with different expectations.
- Digital and technical skills are in short supply.
- 65% of NAM members named talent as their top challenge (Q1 2024).
- Workers are 2.7 times less likely to leave if they can build future skills.
- Job openings were 584,000 in Sep 2026, versus a 2017-19 average of 432,000.
- Hourly pay: $36.92 for all workers, $30.21 for production workers.
- Pay and benefits average $112,261, versus $94,347 for private industry.
Training and automation both help; neither closes a 1.9M gap alone.
Source: Deloitte and Manufacturing Institute (Apr 2024); BLS JOLTS and CES (Sep 2026); NAM (2026).
Value flows from raw materials up through tiers to the OEM.
Contract manufacturers and integrators sit beside the tiers, not above them.
OEMs and brand owners Final product
Design, final assembly and the customer relationship
EMS scale (latest fiscal year)
EMS and ODM makers Foxconn, Flex
Build products for brands; ODMs also design them
- Foxconn (Hon Hai): NT$8.1T, about US$259B in 2025.
- Jabil: $28.9B (FY2024). Flex: $25.8B (FY2025).
- Celestica: $9.7B (2024). Sanmina: $8.1B (FY2025).
- Brands often keep design and the customer; contract makers run the plants.
Tier 1 suppliers Modules
Systems and modules sold directly to the OEM
Tier 2 and 3 suppliers Parts
Components, castings, stampings, fasteners, wire
Materials and equipment Inputs
Steel, resin, chemicals, machine tools, robots
Integrators, services Automation
Design, install and maintain automated lines
A plant's tier shows who sets its quality, volume and pricing rules.
Source: Company annual reports (Foxconn 2025; Flex, Sanmina FY2025; Jabil FY2024; Celestica 2024).
Seven business models shape how a plant buys automation.
Examples are illustrative; one firm can combine several models.
| Model | How it earns | Examples | Automation need |
|---|---|---|---|
| OEM or brand owner | Sells finished products under its own name | Ford, Boeing, Apple | High volume, brand-level quality |
| Contract maker (EMS) | Fee per build, to the customer's design | Flex, Jabil, Foxconn | Flexible lines, fast changeover |
| ODM | Designs and builds; the brand sells it | Quanta, Pegatron, Wistron | Scale and rapid ramp-up |
| Tier 1 or Tier 2 supplier | Multi-year contracts to supply parts | Bosch, Magna, Lear | Cost per part, uptime, traceability |
| Job shop or build to print | Sells machine hours on custom parts | Local machine shops | Low volume, high mix, labor-short |
| Process producer | Sells bulk output by weight or volume | Dow, Nucor, Tyson | Continuous run, energy, safety |
| Vertically integrated maker | Owns many steps and keeps more margin | Tesla | Large capital, in-house tooling |
93.1% of U.S. manufacturers employ fewer than 100 people; most are job shops or small suppliers.
Source: NAM (2026) on firm size; company filings and websites for examples.
A vehicle passes through five stages before it reaches a dealer.
U.S. plants build about 10.2M vehicles a year while buyers take 16.4M.
Materials
Steel, aluminum, resin, copper and chips arrive from primary producers.
Tier 2 and 3 parts
Stampings, castings, wiring and fasteners are made to the OEM's print.
Tier 1 systems
Seats, axles, battery packs and electronics are built as modules.
OEM assembly
Body, paint and final assembly run on fixed-pace lines.
Distribution
Rail and truck carriers move vehicles to dealers.
16.4M
U.S. vehicle sales rate, Sep 2026
10.2M
U.S. vehicle assembly rate, Sep 2026
25%
Section 232 tariff on autos and parts
1.77M
Transportation equipment jobs, Sep 2026
Federal EV purchase credits ended on 30 Sep 2025, so EV battery and cell plans now depend on other incentives.
Source: BEA and Federal Reserve G.17 via FRED (Sep 2026); BLS CES (Sep 2026); Section 232 proclamations.
Electronics assembly is global; chip fabs are new U.S. bets.
Boards and devices are mostly built abroad; leading-edge chip capacity is now being added in the U.S.
Electronics and contract makers
Semiconductor fabs
- Computer and electronics: 1.00M U.S. jobs and $315B of value added (2025).
- California holds 42% of that output: $132B (2025).
- Computer and electronics imports rose 29% in 2025.
- Foxconn, Flex and Jabil assemble most devices for brands.
- Surface-mount board lines are already among the most automated in industry.
- SIA counts over $630B across 140 projects in 28 states (Dec 2025).
- TSMC Arizona plans $165B: Fab 1 (4 nm) runs; Fab 2 (3 nm) targets 2H 2027.
- CHIPS Act: $39B for plants, $11B for R&D; tax credit raised to 35%.
- The U.S. took a 9.9% stake in Intel in Aug 2025, funded by $11.1B of grants.
- Apple plans to buy over 100M Arizona-made chips in 2026.
Fabs need cleanrooms, power and water first; automation follows the building.
Source: BEA via FRED (2025); SIA (Dec 2025); NIST CHIPS (Oct 2026); company reports.
Aerospace, defense and medical goods are low-volume, high-value.
Certification, traceability and tight tolerances matter more than speed in these sectors.
Aerospace
Aircraft, engines, parts
- California has 95,900 aerospace parts jobs; LA County has 53,000 (Sep 2026).
- Washington has the highest concentration; Texas, Georgia, Arizona follow.
- Plants follow the AS9100 quality standard and customer audits.
Defense
Government-funded systems
- Anduril's Arsenal-1 near Columbus is a planned $1B plant (Jan 2025).
- Anduril is based in Costa Mesa on a 640,000 sq ft campus.
- It raised $2.5B in Jun 2025 and $5B in May 2026.
Medical devices
Regulated, small-lot, precise
- Miscellaneous manufacturing (incl. devices): 612,000 jobs, $119B (2025).
- California has 55,300 jobs in this group (Sep 2026).
- FDA rules and ISO 13485 shape every process and record.
Few units, strict records: the case for automation is quality and traceability.
Source: BLS CES (Sep 2026); BEA via FRED (2025); company announcements and filings (2025-26).
Food and drug plants run on recipes, batches and regulation.
These are process industries: output is measured by weight or volume, and cleanliness is a design rule.
Food is the biggest job base
Food manufacturing employs 1.77M people, level with all transportation equipment (Sep 2026).
Food output: $384B
Food, beverage and tobacco added $384B in 2025, about 13% of U.S. manufacturing value added.
Chemicals lead on output
Chemicals, including pharma, added $579B in 2025, about 20% of U.S. manufacturing value added.
Pharma funds the R&D
Pharma was 37.2% of manufacturing R&D in 2025: $160.6B.
Tariff pressure on drugs
A 100% Section 232 tariff on branded drugs began 1 Oct 2025; firms building U.S. plants are exempt.
Batch and continuous process
Recipes, lot tracking and cleaning cycles drive the work; FDA cGMP and FSMA rules set the bar.
Hygiene and traceability rules, not speed, decide where robots fit in these plants.
Source: BLS CES (Sep 2026); BEA via FRED (2025); NAM (2026); Section 232 proclamation (Oct 2025).
Metals, machinery and plastics feed every other sector.
These suppliers sit upstream of autos, aerospace, electronics and construction.
| Segment | Output 2025 | Jobs Sep 2026 | Main customers | Automation angle |
|---|---|---|---|---|
| Machinery | $220B | 1.10M | Farms, mines, factories, builders | Assembly, welding, testing |
| Fabricated metal products | $199B | 1.46M | Machinery, autos, construction | Welding, machining, tending |
| Plastics and rubber | $94B | 695K | Autos, packaging, medical | Press tending, packing |
| Electrical equip. and batteries | $87B | 446K | Utilities, data centers, homes | Winding, assembly, test |
| Primary metals | $78B | 369K | Autos, construction, appliances | Heavy handling, hot work |
| Batteries and cells | In electrical | In electrical | EVs, grid storage, devices | Cell assembly, inspection |
Steel, aluminum and copper face 50% tariffs; EV purchase credits ended 30 Sep 2025.
Source: BEA via FRED (2025); BLS CES (Sep 2026); P.L. 119-21 (Jul 2025).
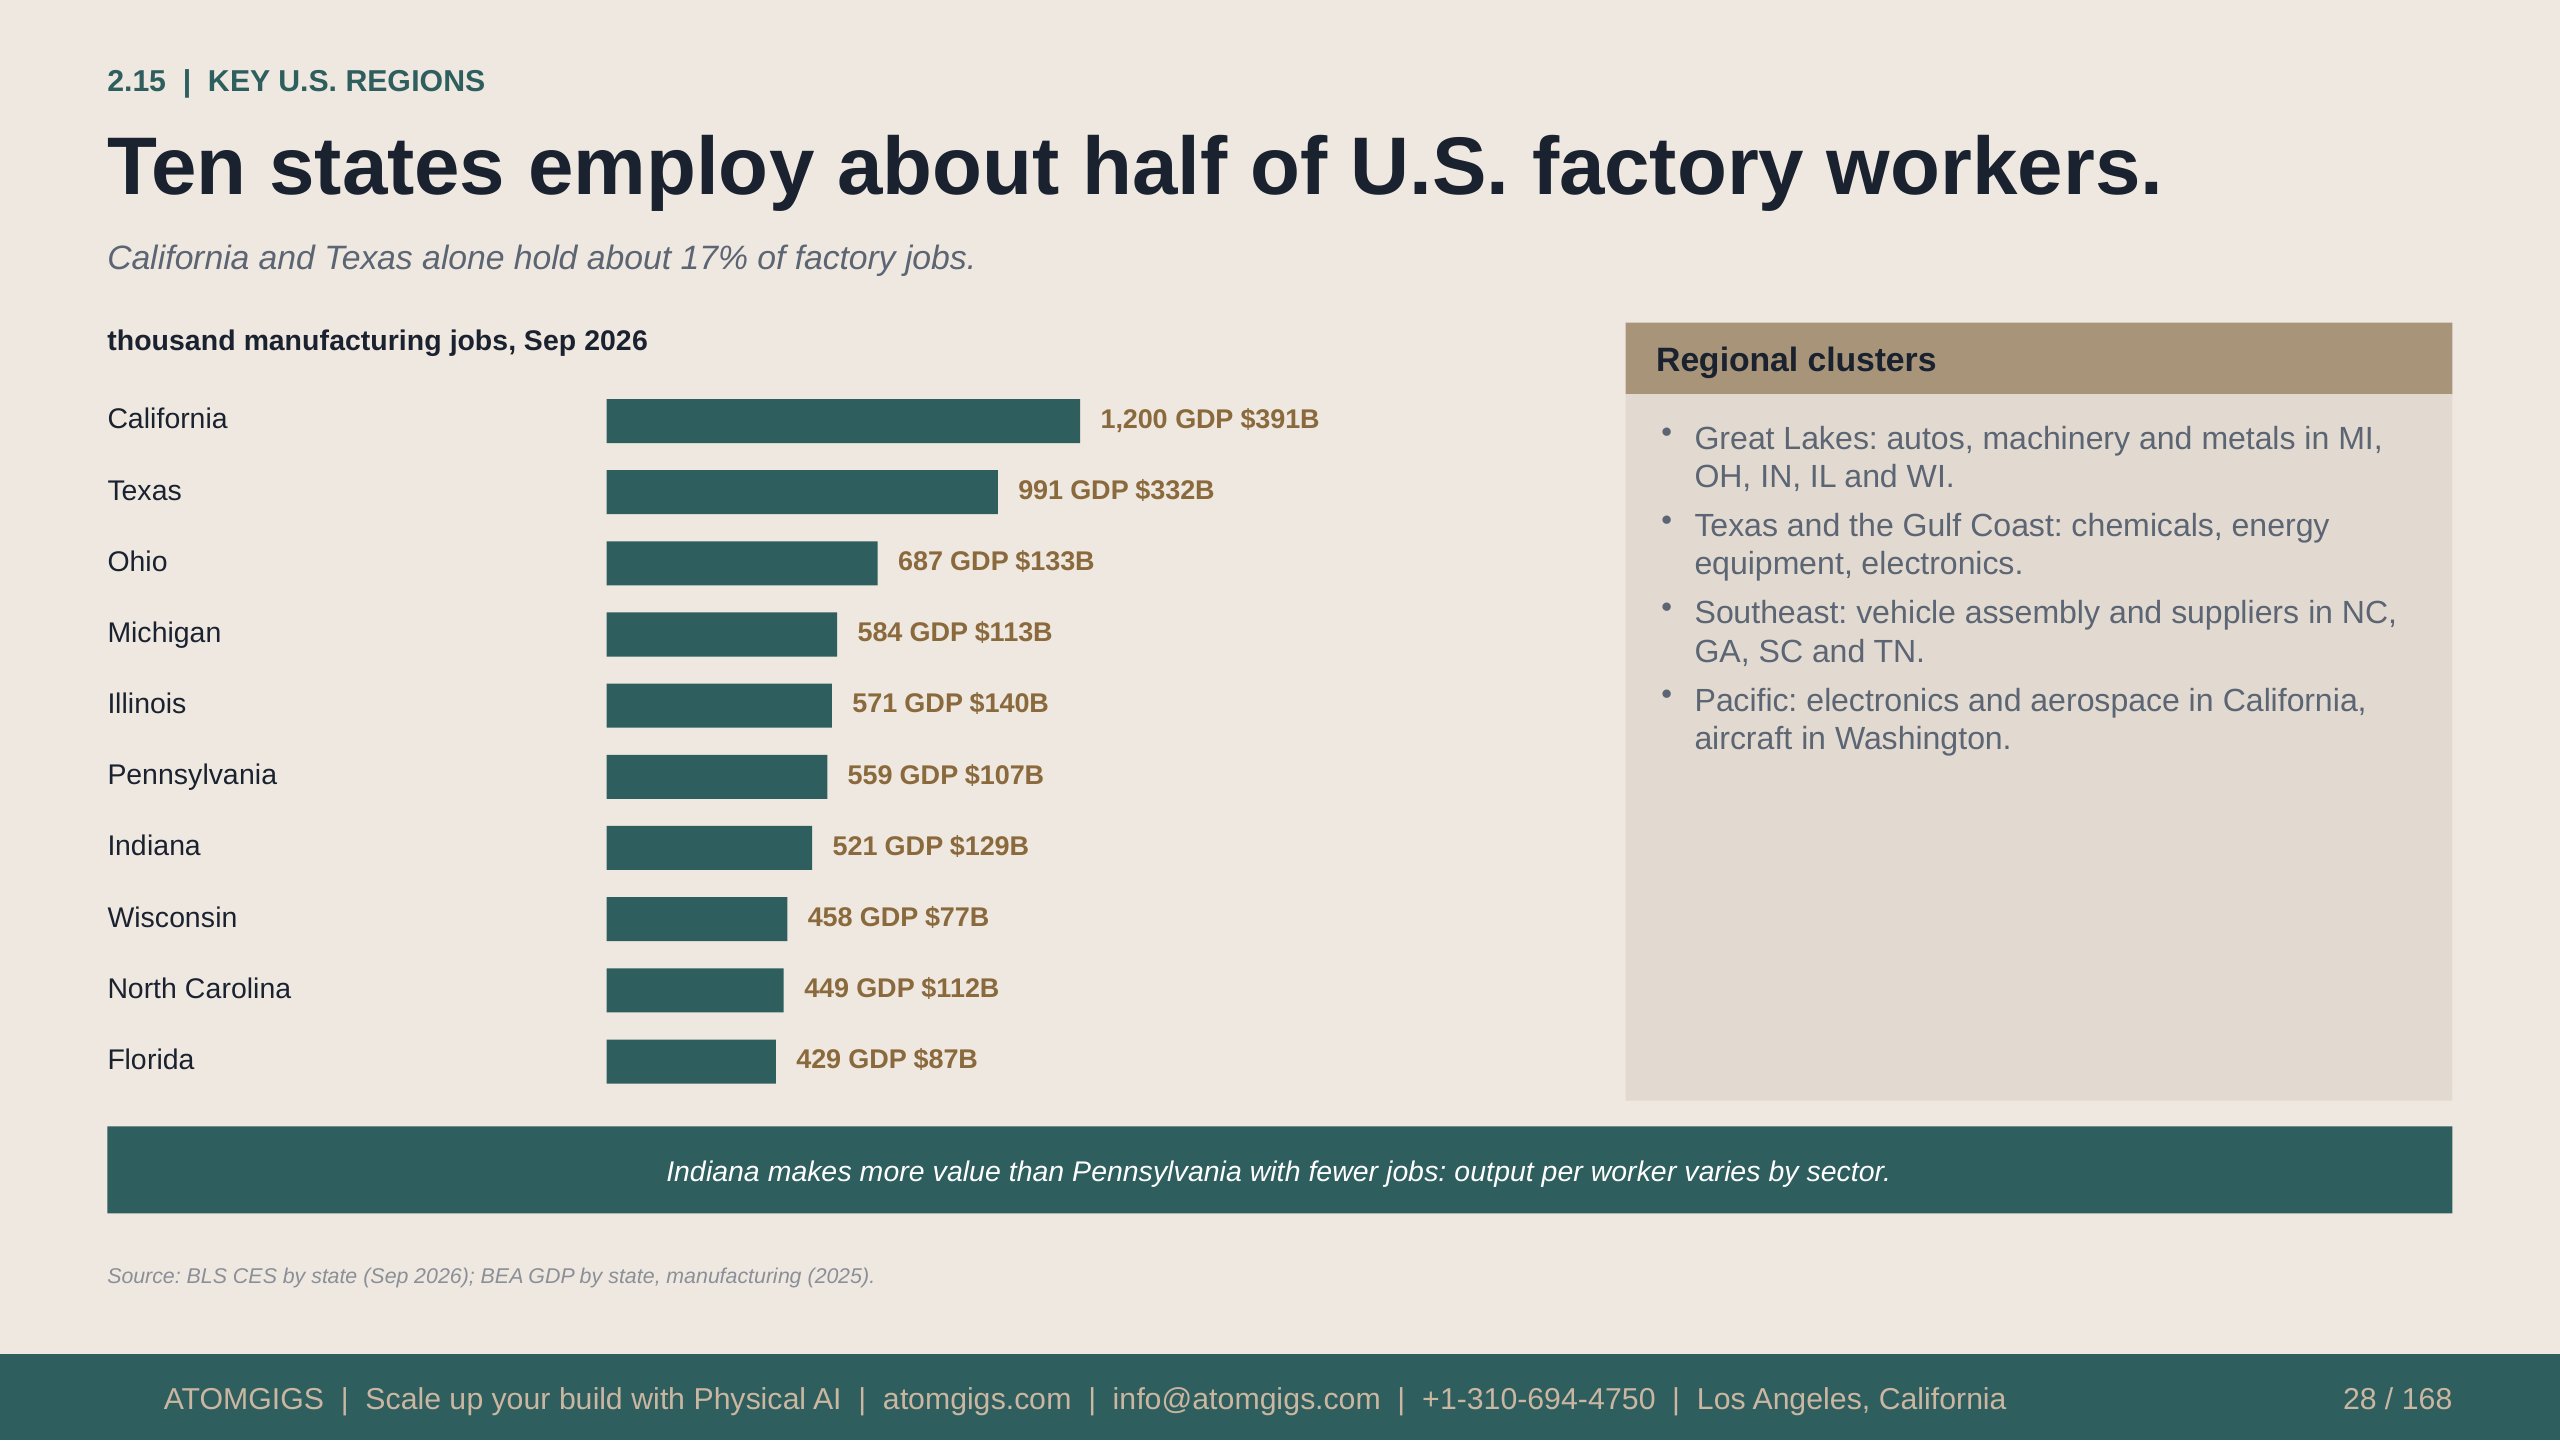
Ten states employ about half of U.S. factory workers.
California and Texas alone hold about 17% of factory jobs.
Text version
thousand manufacturing jobs, Sep 2026
Regional clusters
California
- Great Lakes: autos, machinery and metals in MI, OH, IN, IL and WI.
- Texas and the Gulf Coast: chemicals, energy equipment, electronics.
- Southeast: vehicle assembly and suppliers in NC, GA, SC and TN.
- Pacific: electronics and aerospace in California, aircraft in Washington.
Texas
Ohio
Michigan
Illinois
Pennsylvania
Indiana
Wisconsin
North Carolina
Florida
Indiana makes more value than Pennsylvania with fewer jobs: output per worker varies by sector.
Source: BLS CES by state (Sep 2026); BEA GDP by state, manufacturing (2025).
California makes $391B a year; LA County has 297,000 jobs.
California is the largest manufacturing state by jobs and by output.
1.20M
California manufacturing jobs, Sep 2026
$391B
California manufacturing GDP, 2025
297K
LA County manufacturing jobs, Sep 2026
96K
California aerospace jobs, Sep 2026
42%
California share of U.S. electronics GDP
LA County jobs by sector
Named plants and anchors
- Transportation equipment about 58,000 (Dec 2025); aerospace parts 53,000.
- Food about 37,000 (Dec 2025); apparel 17,000 (Sep 2026).
- Fabricated metal 35,500; computer and electronics 26,300 (Dec 2025).
- Total is down from 340,800 in Sep 2019 and 301,500 in Sep 2025.
- Tesla Fremont: 440 acres, nearly 560,000 vehicles in 2023, about 22,000 workers.
- SpaceX makes rockets and spacecraft at its Hawthorne site in LA County.
- Anduril is based in Costa Mesa (Orange County); Arsenal-1 is in Ohio.
- California apparel has shrunk to about 22,000 jobs statewide.
LA is a high-mix aerospace and food base that is losing jobs: a fit for flexible automation.
Source: BLS CES (Sep 2026); BEA GDP by state (2025); company filings and Wikipedia summaries.
Policy now pairs higher tariffs with tax breaks for equipment.
Status as understood in Nov 2026; tariff rules continue to change through courts and proclamations.
| Policy | What it does | Status |
|---|---|---|
| Section 232 metals | 50% on steel, aluminum, copper; derivatives 25% | In force; 15% for some grid equipment to 2027 |
| Section 232 autos, trucks | 25% autos, parts and trucks; 10% buses | In force; 15% for EU, Japan and Korea |
| IEEPA tariffs | Supreme Court said IEEPA does not allow tariffs | Struck down 20 Feb 2026; about $166B refunds |
| Section 122 | 10% universal tariff for 150 days from 20 Feb 2026 | CIT ruled it illegal 7 May 2026; on appeal |
| CHIPS and Science Act | $39B for plants, $11B for R&D; 35% tax credit | Awards continue; GlobalFoundries up to $955M shifted |
| 100% bonus depreciation | Full first-year write-off for equipment | Permanent for property acquired after 19 Jan 2025 |
| Section 179 and plant expensing | $2.5M limit, $4M phase-out; factory buildings 100% | Construction must start by 2028, in service by 2030 |
| IRA clean-energy credits | EV purchase credits ended; 45X and 48D largely kept | EV credit ended 30 Sep 2025; wind, solar phase out |
Equipment costs less after tax while imports cost more; the average U.S. tariff rate was 12.1% in Jul 2026.
Source: Supreme Court (Feb 2026); Yale Budget Lab (Jul 2026); NIST (Oct 2026); P.L. 119-21 (Jul 2025).
Six constraints limit how fast U.S. plants can expand.
Labor and capital cost are the two that automation can address most directly.
Labor
584,000 open jobs in Sep 2026; 1.9M of 3.8M new jobs could go unfilled by 2033.
Cost of capital
Fed funds rate 3.88% (Oct 2026), prime rate 7.00%, 10-year Treasury 4.95% (3 Nov 2026).
Tariffs and trade rules
Average U.S. tariff rate 12.1% (Jul 2026); court rulings keep changing which duties apply.
Demand and utilization
Factories ran at 75.9% of capacity in Sep 2026; construction spend is 32% below the 2024 peak.
Power and utilities
Industry uses 33.3% of U.S. energy (2024); a new plant needs power, gas and water before it can ramp.
Regulation and permitting
Federal rules cost $29,100 per employee, versus $12,800 for all firms (2022).
Capital is not cheap and labor is not available; both push plants toward automation.
Source: BLS JOLTS (Sep 2026); Federal Reserve via FRED (Oct-Nov 2026); NAM (2026); Yale Budget Lab (Jul 2026).
Factory types and sites
What kinds of factories exist, how they are laid out, and where they get built.
Factories differ by product, layout and scale.
Seven common plant types, from a job shop to a gigafactory.
| Type | What it makes | Typical layout | Automation | Example |
|---|---|---|---|---|
| Job shop | One-offs, prototypes, tooling | Functional (by machine type) | Low to medium | Contract machine shop |
| Discrete assembly plant | Cars, appliances, machinery | Line or cell | High in autos | Hyundai Metaplant, Georgia |
| Process plant | Chemicals, food, pharma, metals | Continuous flow | High, DCS-led | Chemical plant, brewery |
| Electronics (EMS) plant | Boards and devices for brands | SMT lines plus final assembly | High | Foxconn Zhengzhou, China |
| Semiconductor fab | Chips on 300 mm wafers | Cleanroom bays, wafer loops | Very high | TSMC Arizona Fab 21 |
| Gigafactory | Batteries and vehicles at scale | Mega line, many sub-plants | Very high | Toyota, Liberty, North Carolina |
| Aerospace final assembly | Aircraft | Fixed-position or slow line | Low to medium | Boeing Everett, Washington |
The more variety and the lower the volume, the more people a plant needs; the reverse favors automation.
Source: company releases (Toyota 2025, Hyundai, TSMC 2025); Boeing Everett per Wikipedia (2026).
Four layouts cover almost every factory floor.
Layout follows volume and variety: the product moves, the work moves, or the product stays put.
Product line
Stations in the order of the work
- Fits high volume and few variants
- Conveyor or AGV carries the product
- Cars, appliances, bottling
- Weakest station sets the pace
Cell
Machines grouped around one part family
- Fits medium volume and many variants
- One operator or robot serves several machines
- Common for machining and welding
- Easy to copy and scale cell by cell
Functional (job shop)
Machines grouped by type
- Fits low volume and high variety
- Parts travel between departments
- Highest flexibility, longest lead time
- Work-in-process piles up between steps
Fixed position
The product stays; crews and tools come
- Fits very large or heavy products
- Aircraft, ships, turbines, large machinery
- Needs cranes and careful sequencing
- Hard to automate beyond tools and AGVs
A car plant is five shops in a fixed sequence.
Press, body, paint and final assembly each have their own machines, buffers and skills.
Stamping
Presses cut and form sheet steel or aluminum into panels, or cast large body parts.
Body shop
Robots weld, rivet and bond panels into the body-in-white. The most automated shop.
Paint shop
Body is cleaned, coated, baked and inspected in climate-controlled booths and ovens.
Trim and final
Seats, wiring, glass, powertrain and battery join the body. Most manual work remains here.
Test and ship
End-of-line checks for function and quality, then vehicles are staged for trucks and rail.
500K
Hyundai Metaplant target vehicles per year
$7.6B
Metaplant build cost (plant only)
8,500
Planned human workers by 2031
Body shops are heavily robotic; trim and final assembly is where people still do most of the work.
Source: Automotive Manufacturing Solutions on Hyundai Metaplant America (2026).
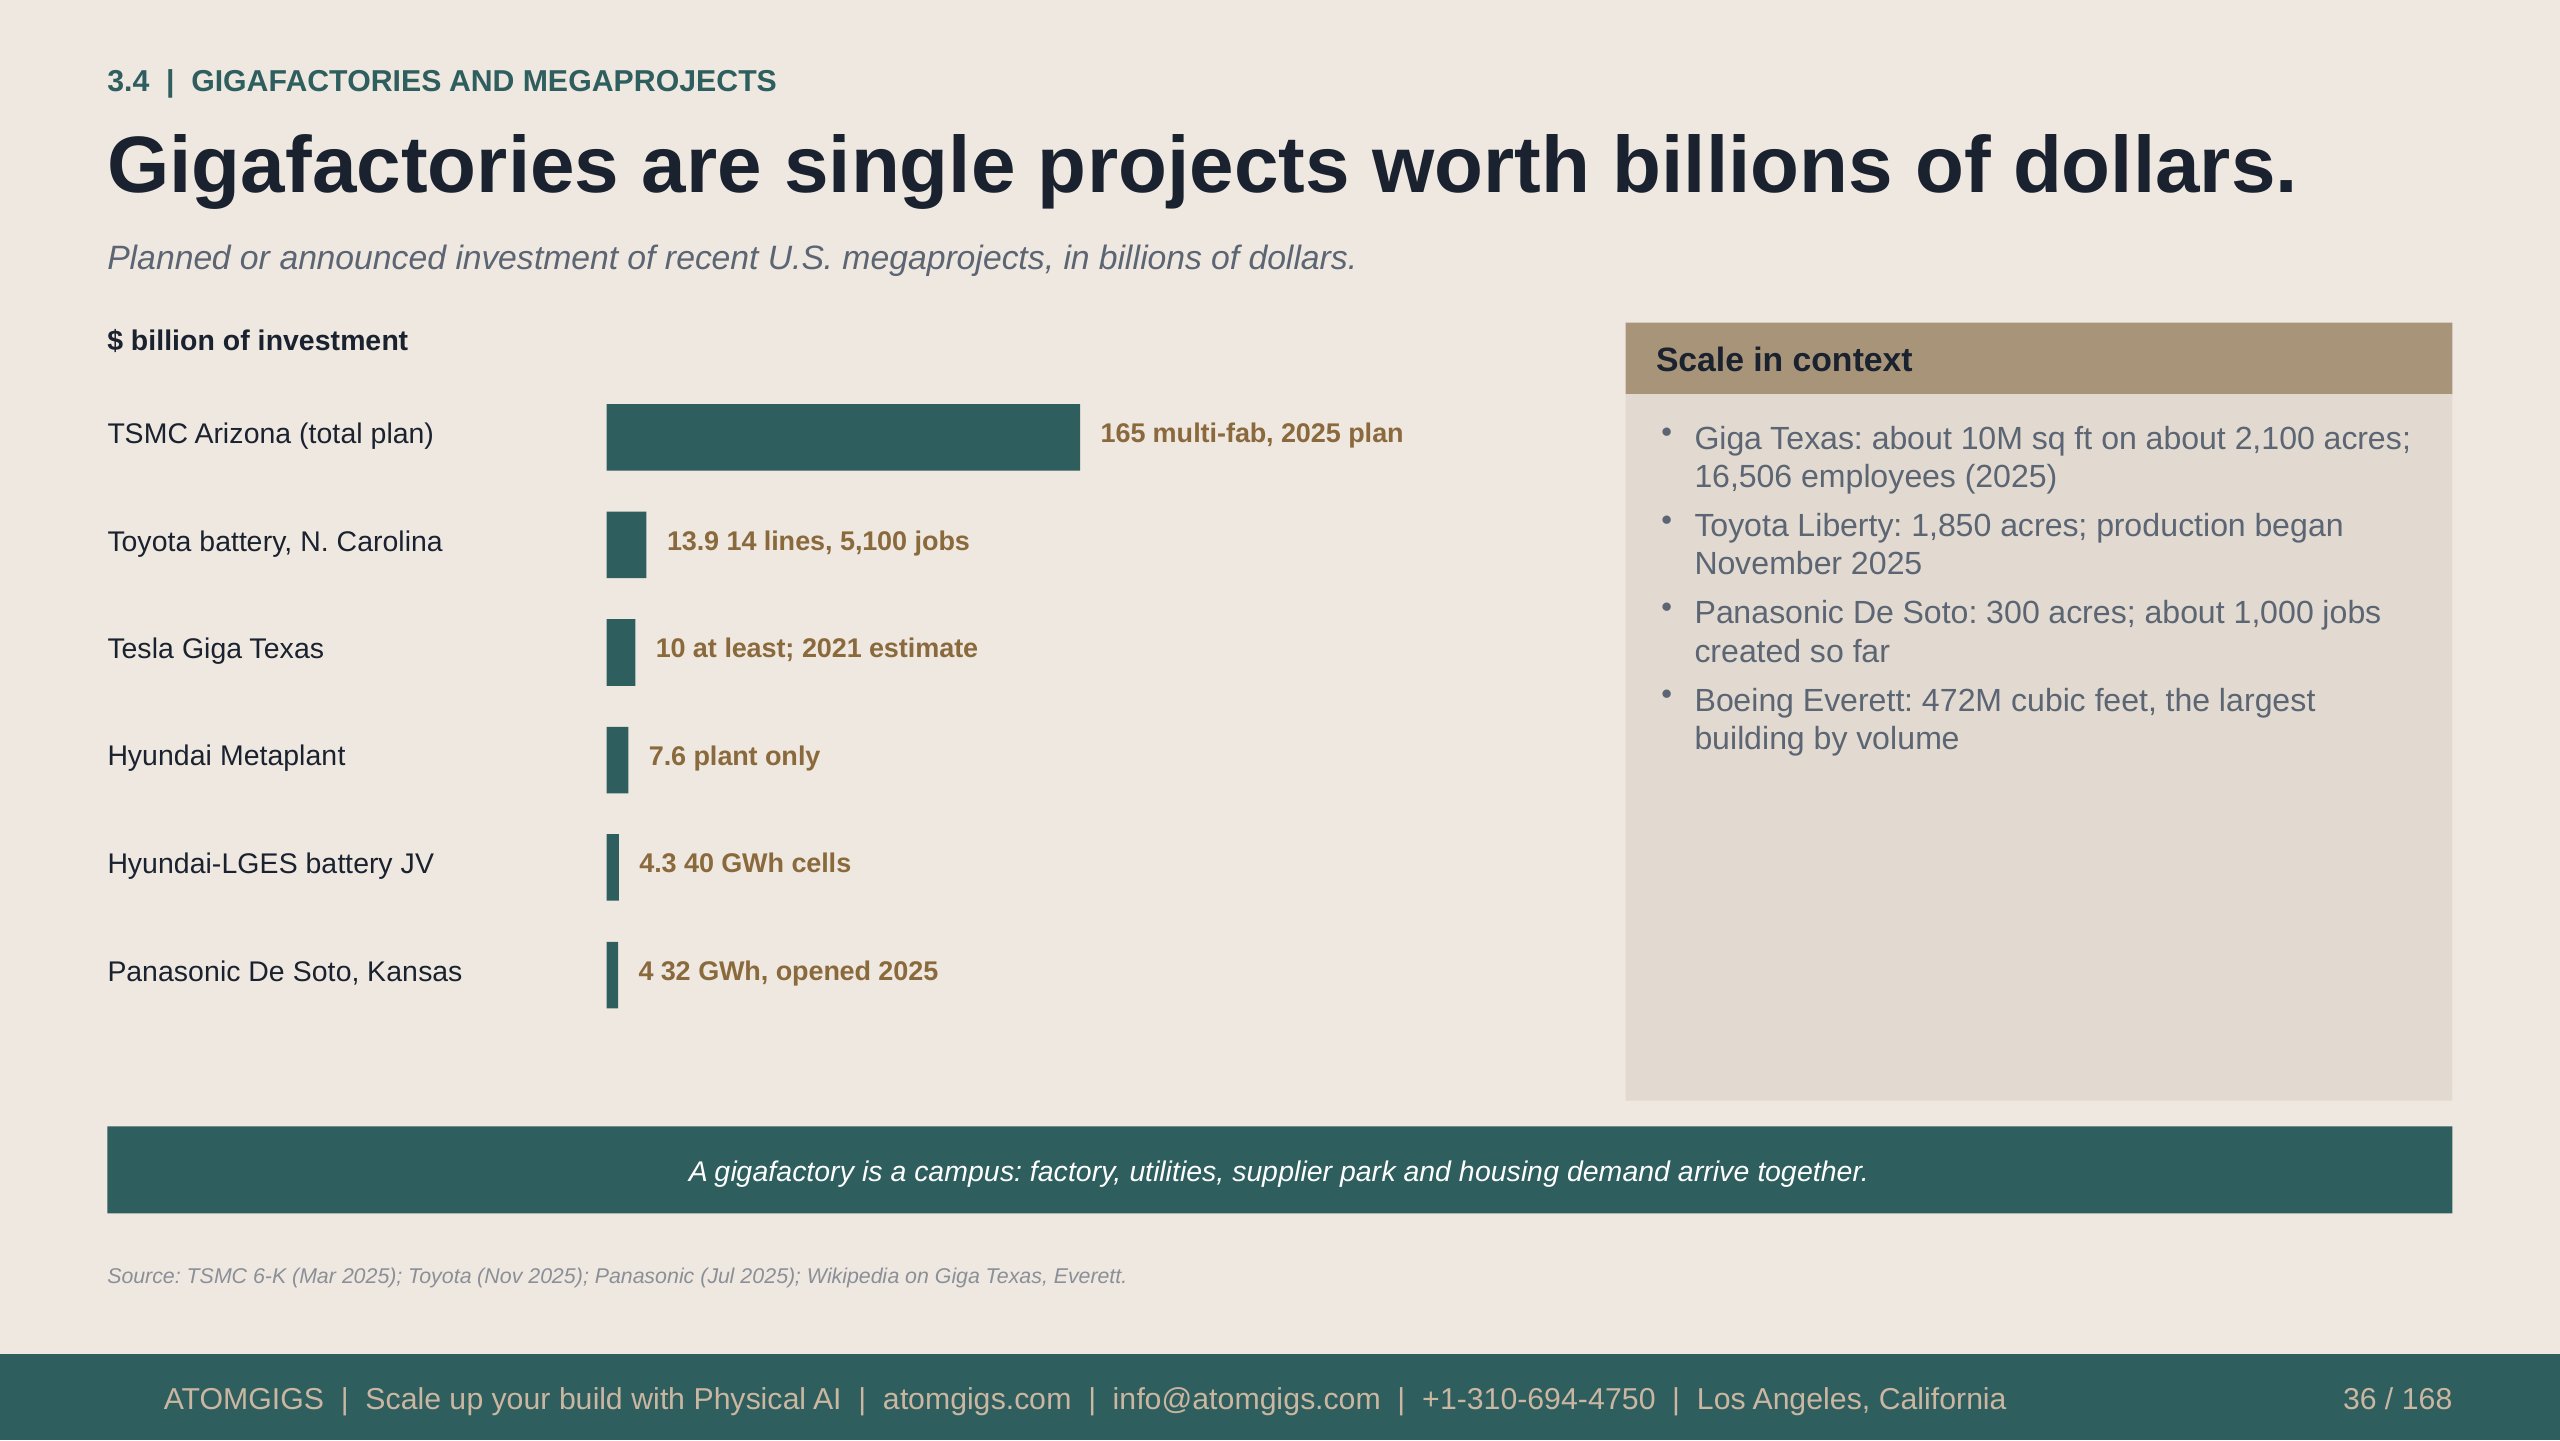
Gigafactories are single projects worth billions of dollars.
Planned or announced investment of recent U.S. megaprojects, in billions of dollars.
Text version
$ billion of investment
Scale in context
TSMC Arizona (total plan)
165 multi-fab, 2025 plan
- Giga Texas: about 10M sq ft on about 2,100 acres; 16,506 employees (2025)
- Toyota Liberty: 1,850 acres; production began November 2025
- Panasonic De Soto: 300 acres; about 1,000 jobs created so far
- Boeing Everett: 472M cubic feet, the largest building by volume
Toyota battery, N. Carolina
13.9 14 lines, 5,100 jobs
Tesla Giga Texas
10 at least; 2021 estimate
Hyundai Metaplant
7.6 plant only
Hyundai-LGES battery JV
4.3 40 GWh cells
Panasonic De Soto, Kansas
4 32 GWh, opened 2025
A gigafactory is a campus: factory, utilities, supplier park and housing demand arrive together.
Source: TSMC 6-K (Mar 2025); Toyota (Nov 2025); Panasonic (Jul 2025); Wikipedia on Giga Texas, Everett.
Power and land now come before labor in site selection.
Eight factors that decide where a plant is built.
Power
Grid capacity and price. Consultants now call power the gatekeeper that screens sites first.
Land and permits
Right size, shape and zoning with a credible permitting path, or the site is dropped early.
Workforce
Skills, wages and training pipeline that must hold for 20 to 30 years.
Water and wastewater
A frequent constraint at scale, especially in chemicals, food and semiconductors.
Logistics
Highway, rail, port and airport access for inbound parts and outbound product.
Supplier base
Nearby tier-1 and tier-2 suppliers cut cost, inventory and risk.
Incentives and taxes
Abatements and grants; some states let property depreciate to a 10% tax base.
Risk
Flood, heat, seismic, policy and community risk over the life of the plant.
Sites with power, water and permits already in place win projects over cheaper but unready land.
Source: Area Development, Q1 and Q2 2026.
The build, buy or retrofit choice sets cost and speed.
Three routes to new capacity, each with different trade-offs.
Greenfield
New building on undeveloped land
- Free design: layout, utilities, automation from day one
- Highest upfront cost and longest schedule, measured in years
- Permits and long-lead equipment drive timing
- Easiest to make robot- and data-ready
Brownfield
Reuse an existing industrial site
- Shell, power and permits often exist
- Faster start and lower startup cost, measured in months
- Hidden costs: legacy systems, undocumented utilities
- May carry environmental cleanup duties
Retrofit
Upgrade a running plant, line by line
- Add robots, sensors and software to current lines
- Production must continue during the work
- Needs a phased plan and weekend or shutdown windows
- Lowest capital, ceiling set by the old layout
Most robot projects in existing plants are retrofits, so integration with legacy equipment decides success.
Source: iFactory AI vendor comparison (2026), indicative; Area Development (2026).
Processes and plant technology
How things are actually made, and the systems that run a plant.
Every factory runs on five systems.
Inputs enter, five systems transform them, and product, scrap and data leave.
- Orders and designs
- Demand, CAD, BOM
- Finished goods
- Shipped to customers
- Materials and parts
- Raw stock, bought-in parts
- Production
- Machines, cells and lines
- Material flow
- Store, move, kit and ship
- Scrap and rework
- Yield loss to minimize
- People
- Operators, technicians
- Utilities and building
- Power, air, water, HVAC
- Control and IT
- PLC, SCADA, MES, ERP, network
- Data
- Traceability, OEE, cost
- Energy and water
- Power, gas, air, water
- Quality and safety
- Inspection, standards, guarding
- Capital
- Building, machines, tools
- Waste and emissions
- Heat, water, material
Robots touch production and material flow, but they depend on the other three systems working.
Eight process families make nearly every product.
Each family changes shape, joins parts or adds a surface.
| Family | Method | Typical equipment | Typical products |
|---|---|---|---|
| Cutting (subtractive) | Remove material to shape | CNC mill, lathe, grinder | Engine blocks, brackets |
| Casting | Pour or inject molten metal into a mold | Die-cast press, foundry | Housings, wheels, body castings |
| Forming | Deform solid metal under force | Forge, stamping press, bender | Body panels, crankshafts |
| Joining | Weld, braze, bond or fasten | Weld cell, laser, screwdriver | Car bodies, frames |
| Molding | Shape polymer in a mold | Injection molding machine | Housings, caps, bottles |
| Additive | Build layer by layer from data | Metal or polymer 3D printer | Prototypes, complex parts |
| Assembly | Fit parts into products | Line, cell, robot, operator | Vehicles, devices, appliances |
| Finishing and coating | Clean, paint, plate, heat-treat | Paint booth, oven, plating line | Painted bodies, plated parts |
Most plants chain several families, so a robot at one step must fit the steps before and after it.
CNC machining turns a digital design into a cut part.
The same five steps apply to a 3-axis mill and a 5-axis machining center.
Design
CAD model of the part with tolerances and material.
Program
CAM software plans tool paths and writes the machine code (G-code).
Set up
Load stock, mount the fixture, set tools and work offsets.
Cut
The machine removes material; coolant and chip handling run alongside.
Inspect
Probe on the machine or a coordinate measuring machine checks the part.
Loading, unloading and offset checks are repeat tasks that robots and operators share in machine tending.
Metal parts start as a pour, a hit or a press stroke.
Four ways to shape metal in bulk before any machining.
Casting
Molten metal into a mold or die
- Sand, die and investment casting
- Good for complex shapes
- Giga-class presses over 9,000 tons
- One casting can replace about 60 welded parts
Forging
Heated metal shaped under force
- Strong grain structure, high fatigue life
- Crankshafts, landing gear, tools
- Hot, loud and hard on equipment
- Robots handle hot billets and transfers
Stamping
Sheet metal cut and formed in dies
- High speed, millions of parts per die set
- Body panels, brackets, appliance shells
- Press lines move parts with transfer robots
- Die changes drive downtime
Bending and extrusion
Sheet, tube and profile forming
- Press brakes bend sheet to angle
- Extrusion pushes metal through a die
- Common in HVAC, furniture, structures
- Press-brake tending suits cobots
Gigacasting folds dozens of steps into one, which shrinks the body shop and the robot count in it.
Source: Reuters/Fox Business on IDRA Gigapress 9,000 (2023).
Welding is the main way to join metal, with many options.
Pick the method by material, thickness, speed and the strength needed.
| Method | How it works | Typical use | Automation fit |
|---|---|---|---|
| Arc (MIG, TIG) | Electric arc melts metal and filler | Frames, pipe, heavy fabrication | Robot arc cells; skilled labor scarce |
| Resistance spot | Current and pressure fuse sheet metal | Car bodies | Standard in body shops |
| Laser | Focused beam gives deep, narrow welds | Battery tabs, thin sheet, tailored blanks | High; needs tight fit-up |
| Friction stir | Spinning tool stirs metal without melting | Aluminum, battery trays, aerospace | Machine or robot based |
| Brazing and soldering | Filler melts, base metal does not | Electronics, HVAC, heat exchangers | Common on boards and tubes |
| Adhesive bonding | Structural glue cures between parts | Car bodies, composites, panels | Dispensing robots with vision |
| Mechanical fastening | Screws, rivets, clinches | Assemblies, serviceable products | Screwdriving and rivet cells |
Welding is a leading robot application because the work is repetitive, hot and hard to staff.
Injection molding repeats a short cycle thousands of times.
Melted plastic is injected into a steel mold, cooled, and ejected as a finished part.
The cycle
What drives cost and quality
- Clamp: two mold halves close under high force
- Inject: melted resin fills the cavity
- Hold and cool: the part solidifies in the mold
- Open and eject: the part drops or is removed by a take-out robot
- Repeat: cycle time often runs seconds to a few minutes
- Mold: precision steel tool, often the largest upfront cost
- Machine size: clamping force must match part area
- Material: resin must be dried and held at set temperatures
- Scrap: runners and rejects are reground or lost
- Automation: take-out robots, inserts, labeling and packing
Plastics plants run lights-out in many cells; the human work is mold changes, quality checks and packing.
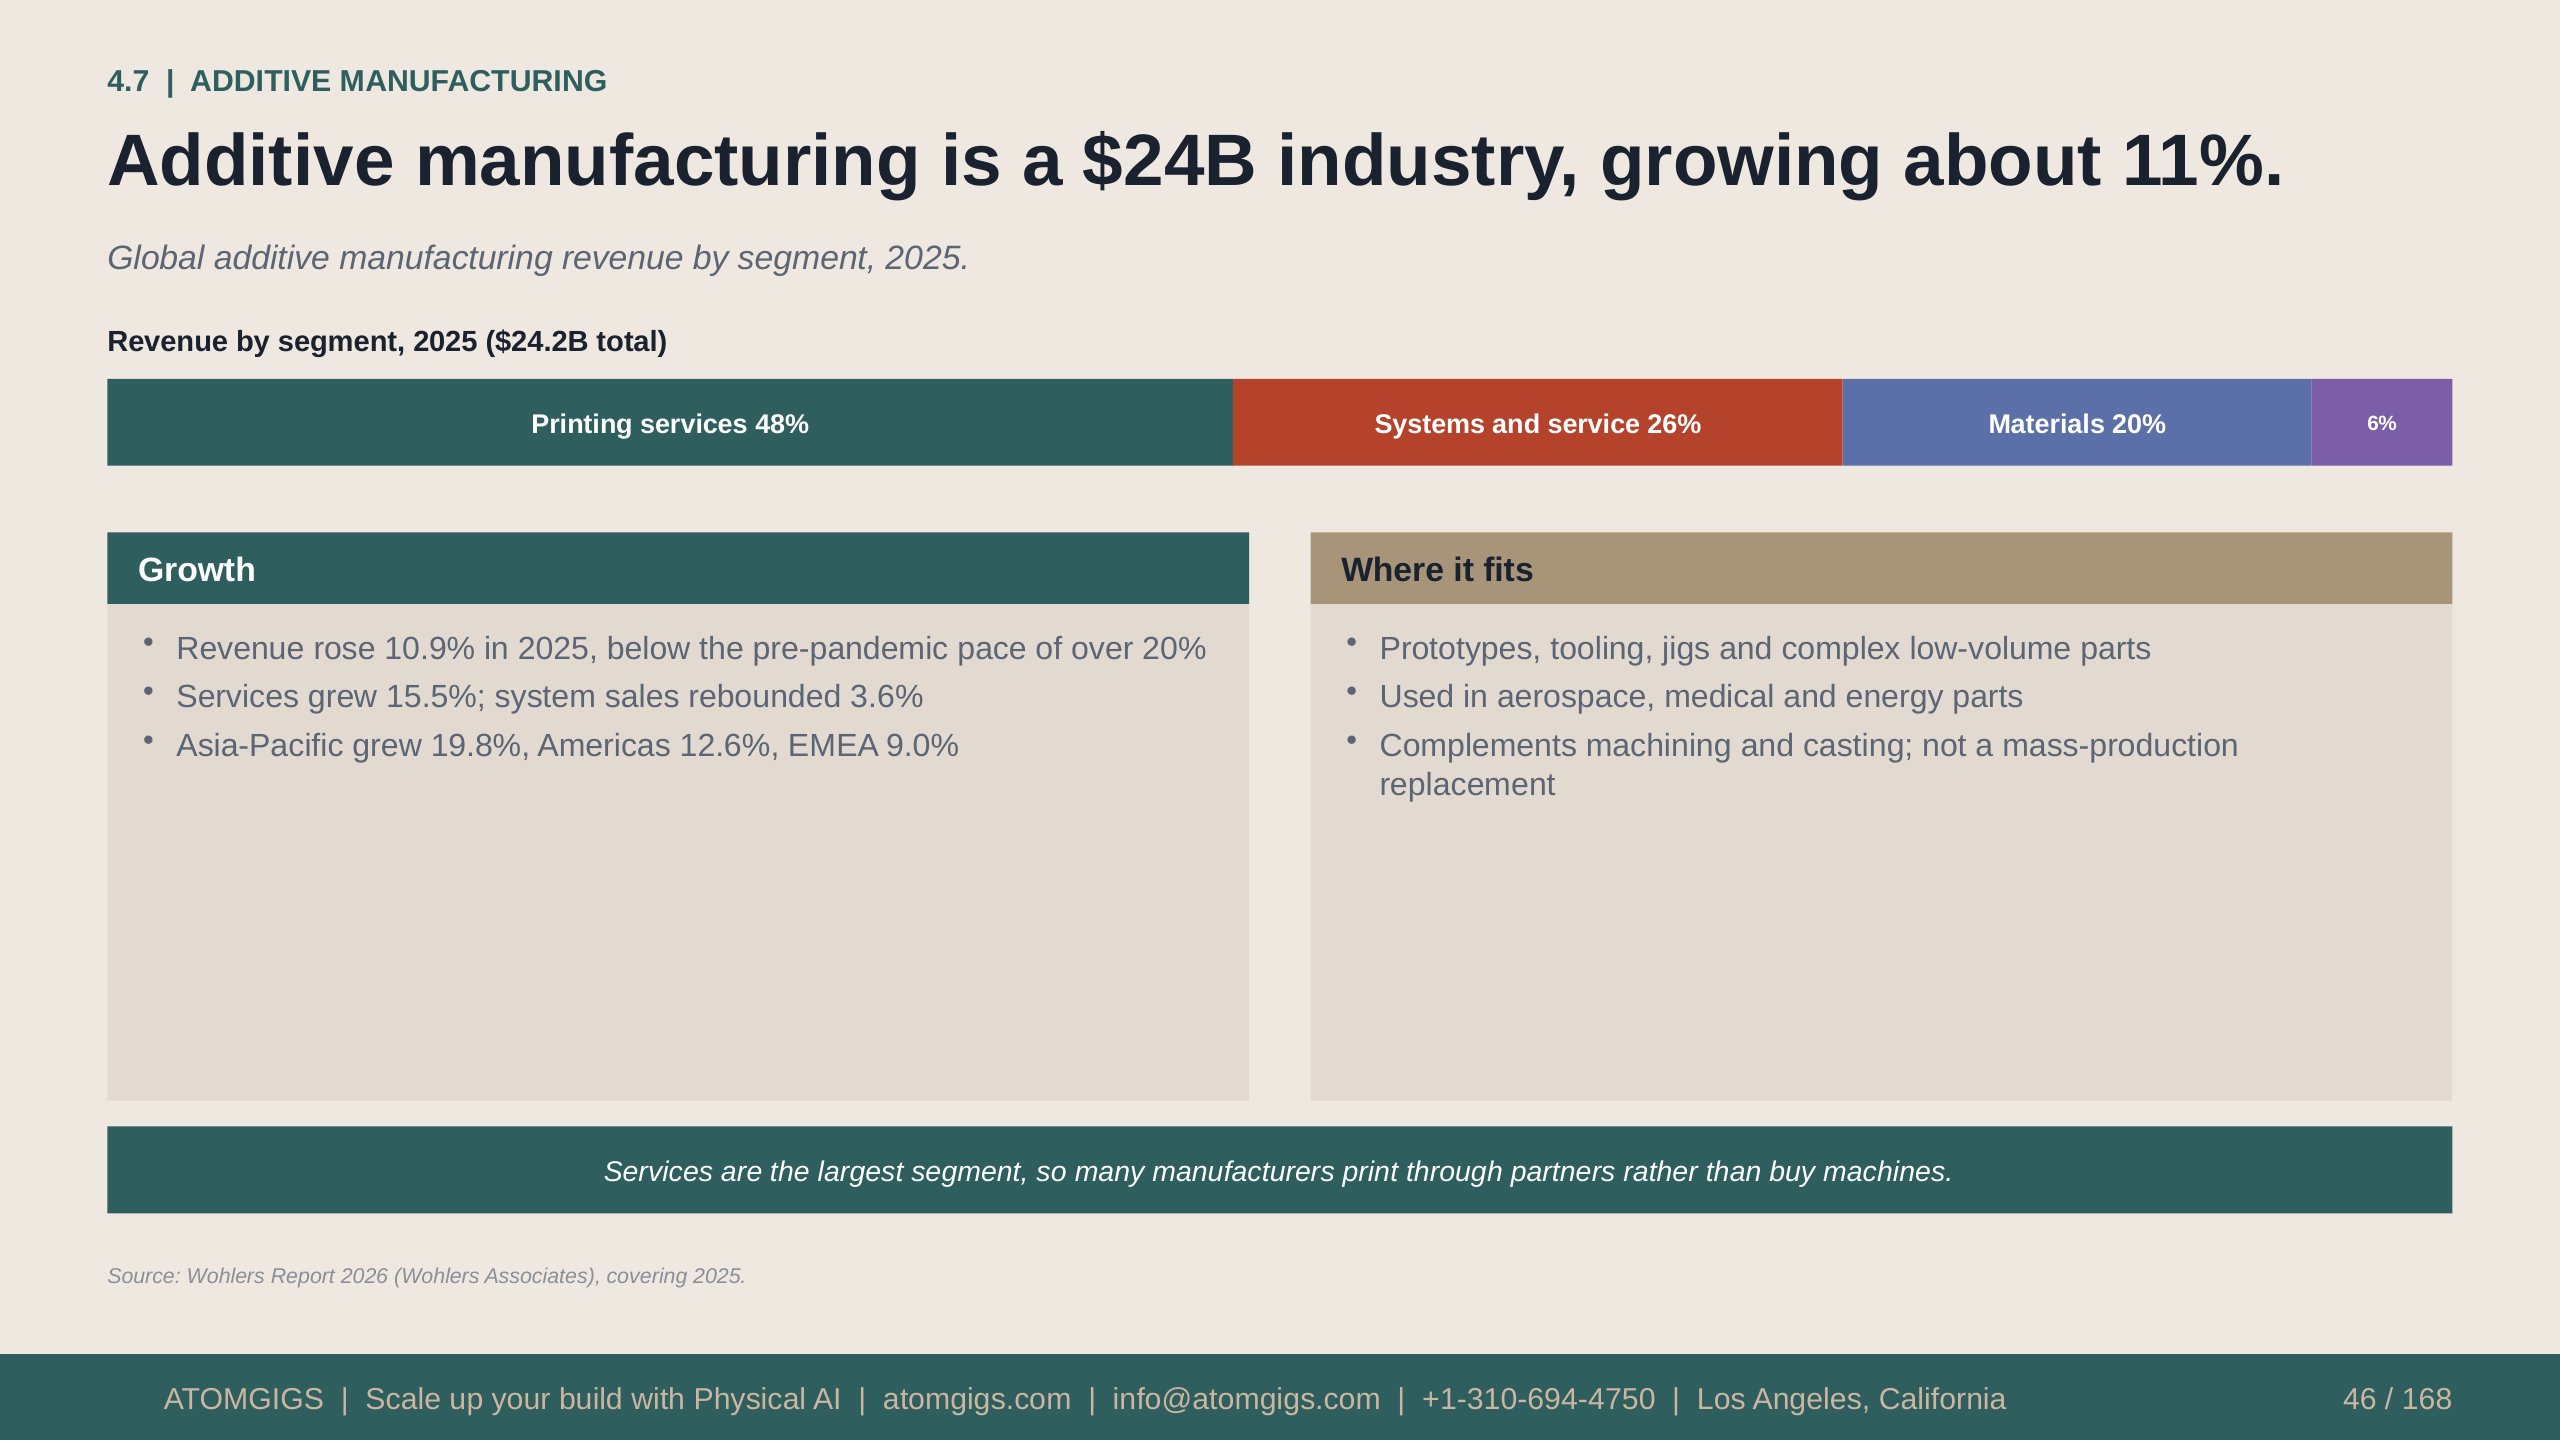
Additive manufacturing is a $24B industry, growing about 11%.
Global additive manufacturing revenue by segment, 2025.
Text version
Revenue by segment, 2025 ($24.2B total)
Printing services 48%
Systems and service 26%
Materials 20%
6%
Growth
Where it fits
- Revenue rose 10.9% in 2025, below the pre-pandemic pace of over 20%
- Services grew 15.5%; system sales rebounded 3.6%
- Asia-Pacific grew 19.8%, Americas 12.6%, EMEA 9.0%
- Prototypes, tooling, jigs and complex low-volume parts
- Used in aerospace, medical and energy parts
- Complements machining and casting; not a mass-production replacement
Services are the largest segment, so many manufacturers print through partners rather than buy machines.
Source: Wohlers Report 2026 (Wohlers Associates), covering 2025.
Assembly is the labor center; painting is the energy center.
The two steps that most shape plant staffing and utility bills.
Assembly
Painting and coating
- Fits parts into sub-assemblies and finished products
- Methods: manual stations, line, cells, automated lines
- Tasks: screwdriving, press-fit, clipping, wiring, testing
- Variety and tight spaces limit full automation
- Cobots, AGVs and vision are filling gaps
- Steps: clean, pretreat, coat, bake, inspect
- Spray booths need controlled temperature and humidity
- In car plants the paint shop can use over half of plant energy
- Robots apply paint consistently and cut solvent waste
- Other coatings: powder, plating, anodizing, sealing
Paint is a strong robot fit: fumes make it hard on people and consistency drives quality.
Source: Products Finishing, automotive paint shop energy article.
Chips need the costliest factories ever built.
Boards are assembled by machine; chips are built layer by layer in cleanrooms.
$165B
TSMC planned U.S. investment (2025)
$340M
Top price of one EUV lithography tool
>$1B
Cost of a new fab; tens of billions common
300 mm
Standard wafer size today
Board assembly (SMT line)
Semiconductor fab
- Solder paste printer, then pick-and-place machines place parts
- Reflow oven melts solder; optical inspection checks every board
- Through-hole parts and final assembly follow, often by hand
- Wafers loop through deposition, lithography, etch and cleaning
- Cleanroom, vibration and temperature control are strict
- TSMC Arizona Fab 21 produced 4nm-class chips by January 2025
Fabs are highly automated already; overhead transport and wafer handling are the robot story there.
Source: TSMC 6-K (Mar 2025); Wikipedia, Semiconductor fabrication plant; Tom's Hardware (Jan 2025).
Automation stacks five layers from sensor to ERP.
The ISA-95 model: faster control at the bottom, slower business planning at the top.
Enterprise: ERP ISA-95 L4
Orders, inventory, finance, supply chain
How to read it
- Control acts in milliseconds; supervision in seconds; MES in minutes; ERP in hours to days
- PLCs run machines; SCADA shows and logs; MES ties work orders to machines
- The Purdue model uses the same levels to draw security zones
- Robots sit at level 1 with their own controller, linked to a PLC
Operations: MES ISA-95 L3
Scheduling, tracking, quality, traceability
Supervisory: SCADA, HMI ISA-95 L2
Monitor, alarm and set targets for an area
Control: PLC, robot ISA-95 L1
Run machine logic in milliseconds
Field: sensors, drives ISA-95 L0
The physical process and the devices on it
A robot project has to plug into this stack, not just sit on the floor.
Source: ISA-95 / Purdue model summary (IT/OT Insider, 2025).
Machine vision is a $5.9B market and AI is gaining share.
Cameras and sensors give machines eyes; AI software judges what they see.
$5.9B
Machine vision market, 2025
$8.3B
Forecast for 2030
~25%
AI share of vision software, 2025
~40%
AI share of vision software, 2030
Sensors in a plant
AI inspection
- Proximity, photoelectric and limit switches detect parts
- Encoders and load cells measure position and force
- 2D and 3D cameras, laser scanners and thermal imagers inspect
- Vibration and temperature sensors feed predictive maintenance
- A model learns good and bad parts from labeled images
- Handles variation that fixed rules miss, such as surface defects
- Needs defect samples, lighting control and ongoing retraining
AI vision grows fastest where defects vary, such as surfaces, welds, textiles and food.
Source: Interact Analysis, machine vision forecast (2025).
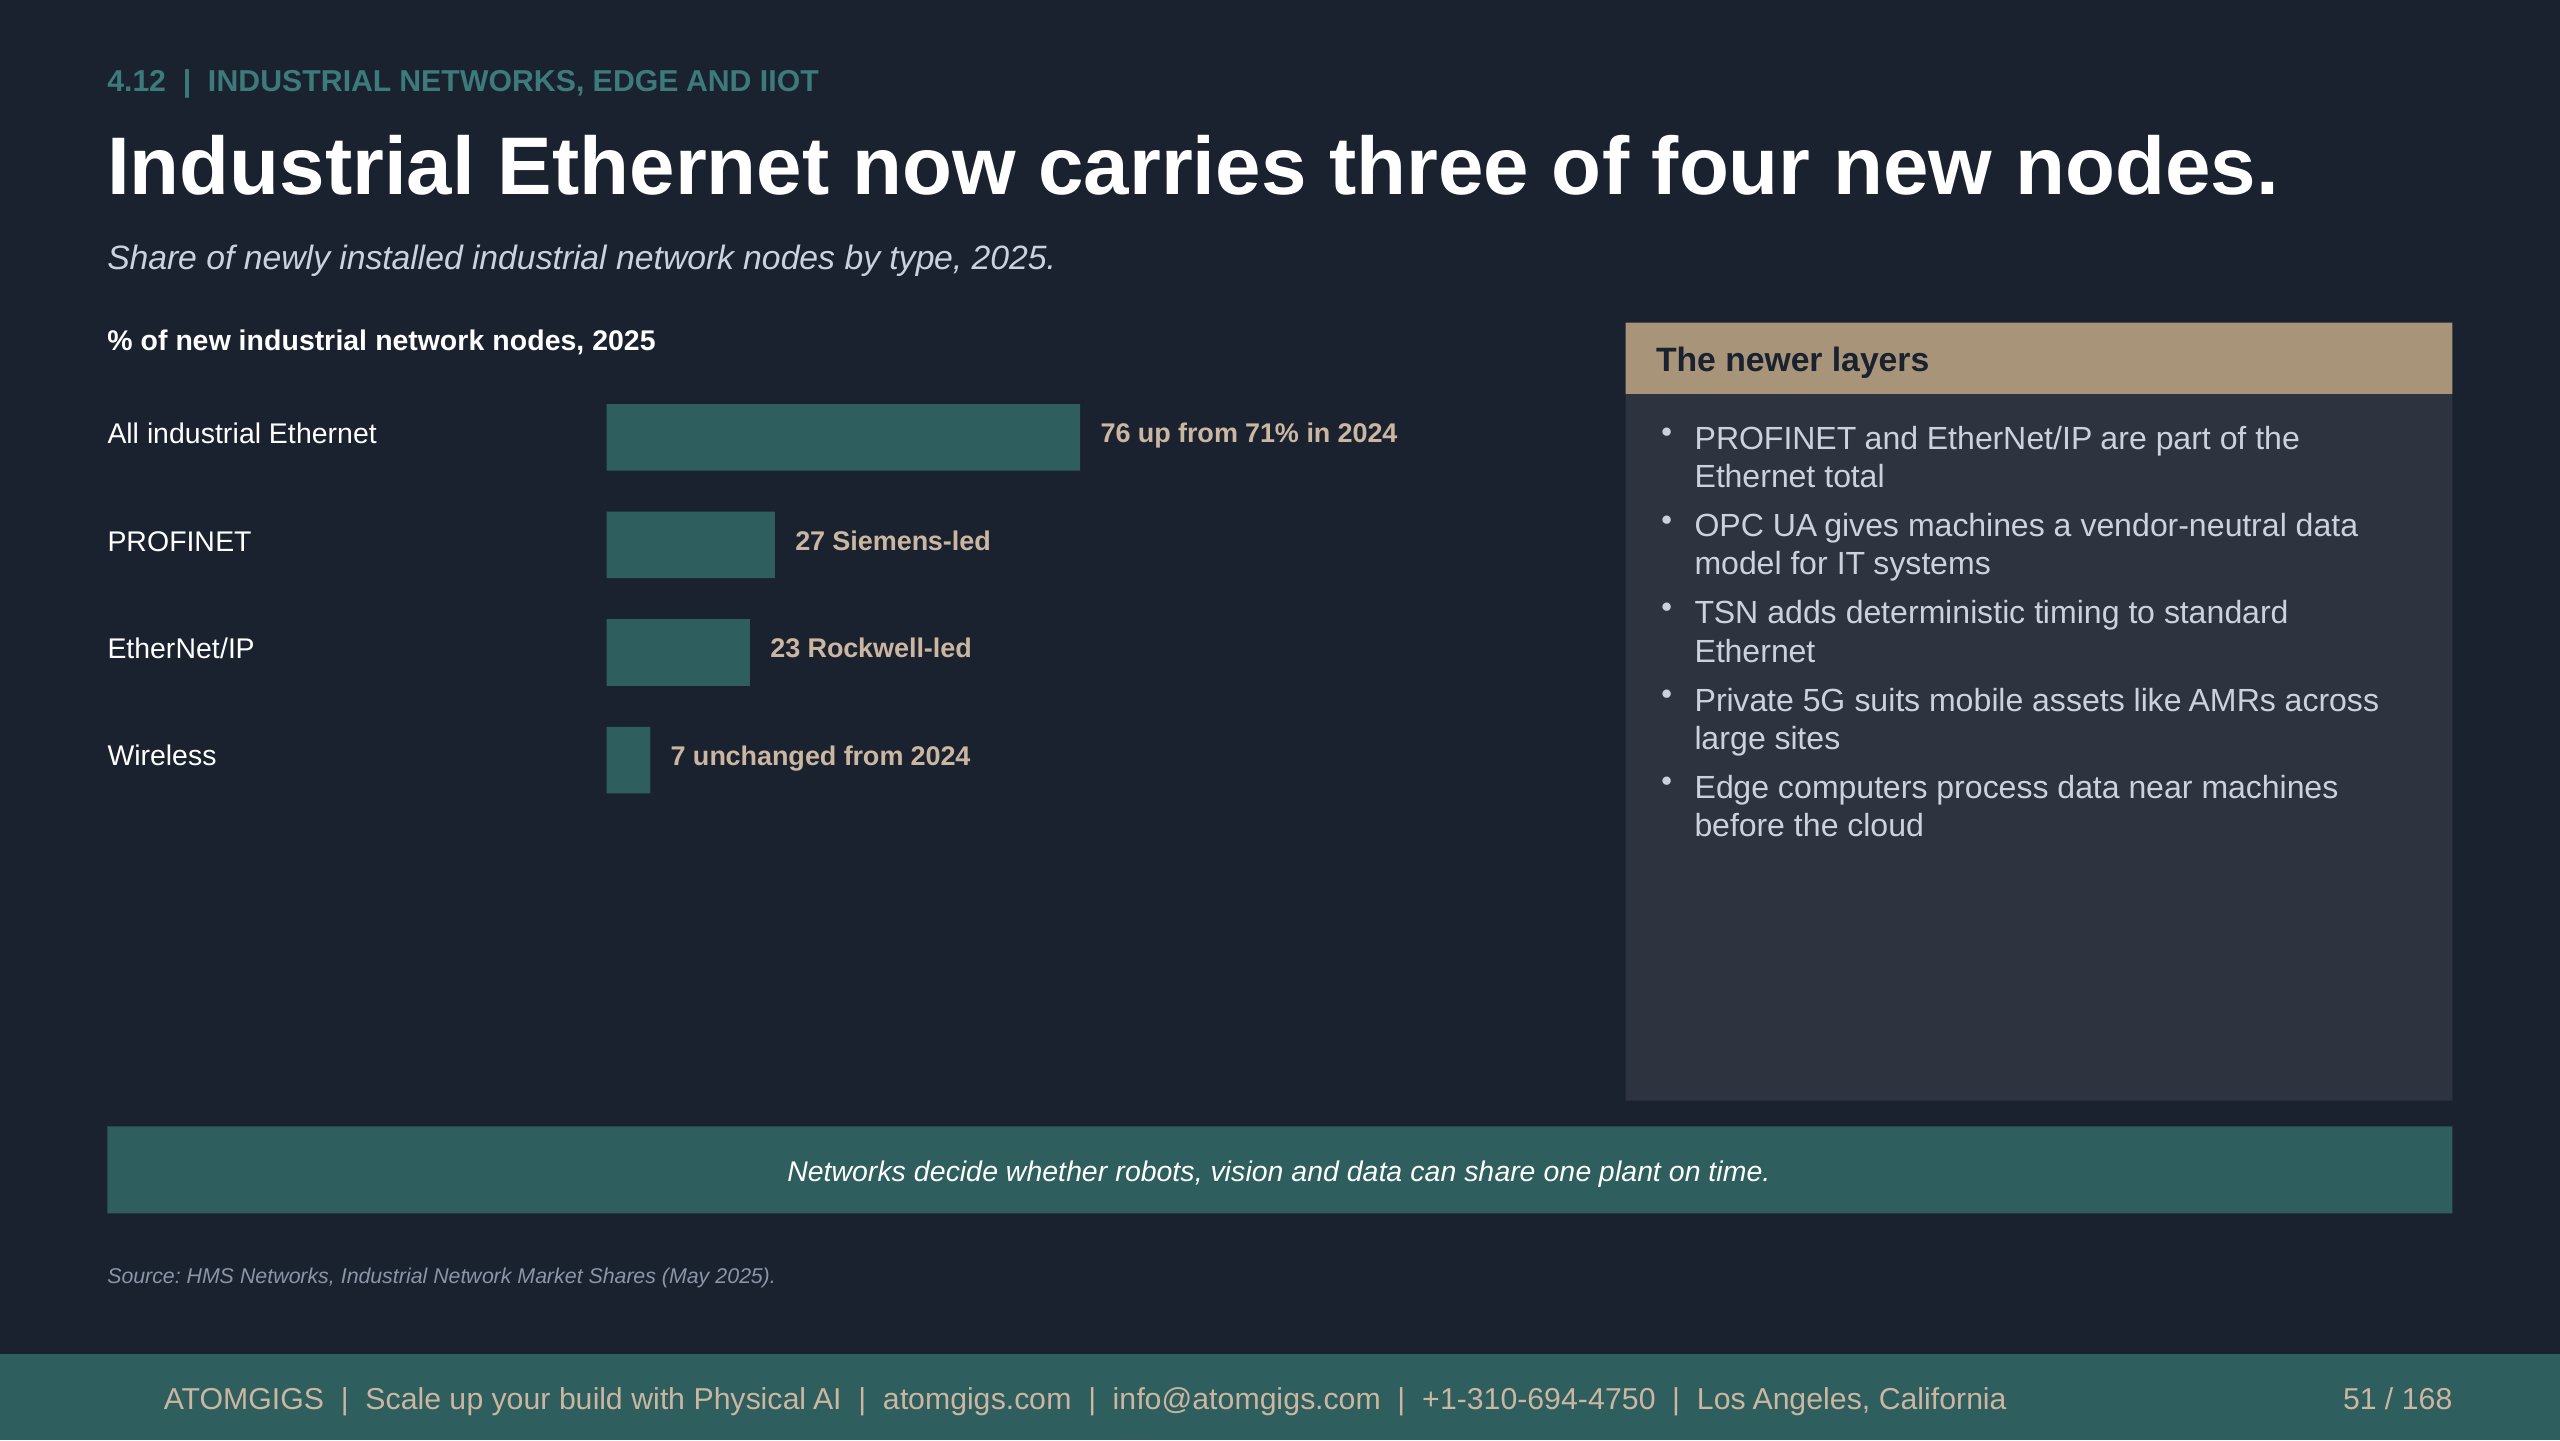
Industrial Ethernet now carries three of four new nodes.
Share of newly installed industrial network nodes by type, 2025.
Text version
% of new industrial network nodes, 2025
The newer layers
All industrial Ethernet
76 up from 71% in 2024
- PROFINET and EtherNet/IP are part of the Ethernet total
- OPC UA gives machines a vendor-neutral data model for IT systems
- TSN adds deterministic timing to standard Ethernet
- Private 5G suits mobile assets like AMRs across large sites
- Edge computers process data near machines before the cloud
27 Siemens-led
EtherNet/IP
23 Rockwell-led
Wireless
7 unchanged from 2024
Networks decide whether robots, vision and data can share one plant on time.
Source: HMS Networks, Industrial Network Market Shares (May 2025).
Moving parts takes as much planning as making them.
Four families of equipment move material inside the plant.
Conveyors and sortation
Fixed paths for steady flow
- Belt, roller, overhead and chain conveyors
- Lowest cost per move on fixed routes
- Hard to reroute after layout changes
- Feed packing, palletizing and shipping
AGVs and AMRs
Driverless carts and mobile robots
- AGVs follow set paths; AMRs navigate by map
- Move kits, pallets and totes between areas
- Hyundai Metaplant uses AGVs instead of conveyors
- Fleet software manages traffic and charging
Storage and retrieval
Racks, shuttles and AS/RS
- Store parts and finished goods densely
- Shuttles and cranes serve high racks
- Link to ERP or warehouse software
- Supports kitting and line-side supply
Forklifts and tuggers
Operated and automated trucks
- Still the workhorse of most plants
- Autonomous forklifts add pallet moves
- Overhead cranes serve heavy work
- Safety and traffic rules matter most
Intralogistics is often the first robot use case because routes and loads are simple to define.
Source: Automotive Manufacturing Solutions on Hyundai Metaplant America (2026).
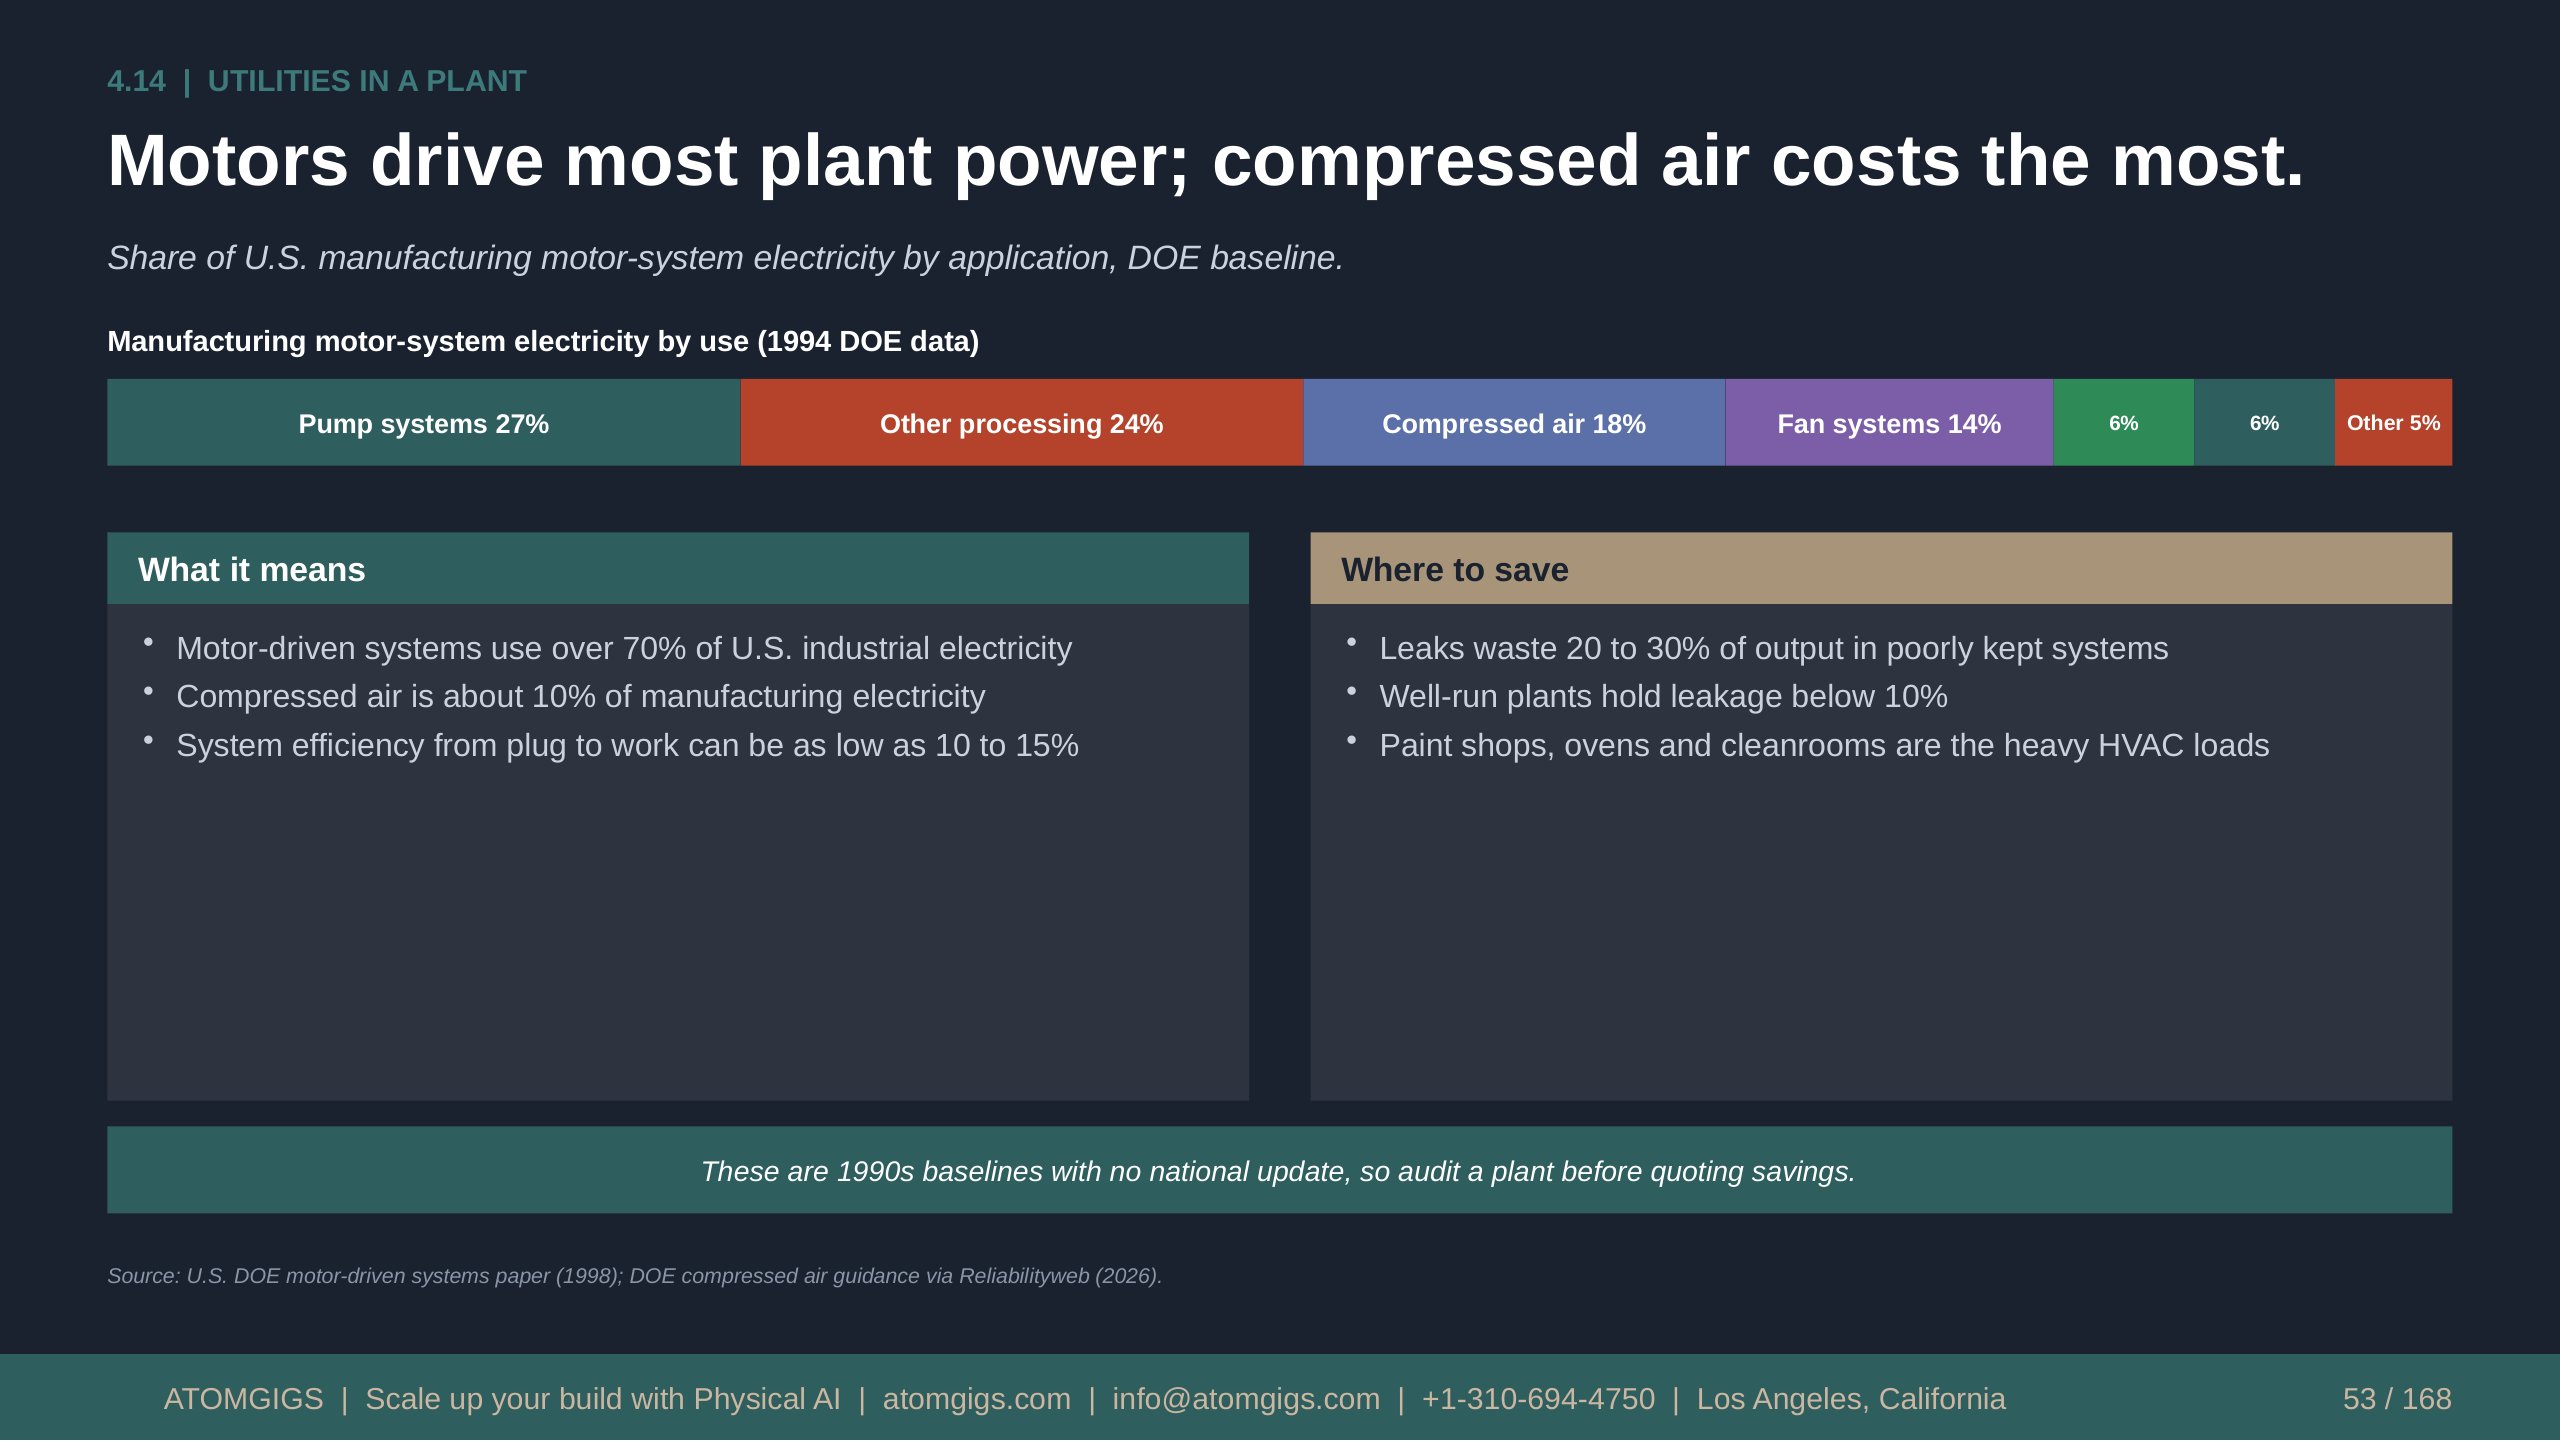
Motors drive most plant power; compressed air costs the most.
Share of U.S. manufacturing motor-system electricity by application, DOE baseline.
Text version
Manufacturing motor-system electricity by use (1994 DOE data)
Pump systems 27%
Other processing 24%
Compressed air 18%
Fan systems 14%
6%
6%
Other 5%
What it means
Where to save
- Motor-driven systems use over 70% of U.S. industrial electricity
- Compressed air is about 10% of manufacturing electricity
- System efficiency from plug to work can be as low as 10 to 15%
- Leaks waste 20 to 30% of output in poorly kept systems
- Well-run plants hold leakage below 10%
- Paint shops, ovens and cleanrooms are the heavy HVAC loads
These are 1990s baselines with no national update, so audit a plant before quoting savings.
Source: U.S. DOE motor-driven systems paper (1998); DOE compressed air guidance via Reliabilityweb (2026).
Each industry has its own quality standard on top of ISO 9001.
Customers and regulators require certification before they buy or allow sale.
| Standard | Scope | Who needs it | Note |
|---|---|---|---|
| ISO 9001 | General quality management system | Any manufacturer | The base for sector standards |
| IATF 16949 | Automotive quality management | Suppliers to car makers | 93,713 sites worldwide; 3,699 in the U.S. |
| AS9100 | Aerospace and defense quality | Aircraft and space suppliers | Builds on ISO 9001 |
| ISO 13485 | Medical device quality system | Device makers and suppliers | Basis of the new FDA rule |
| FDA QMSR (21 CFR 820) | U.S. device quality regulation | Device makers selling in the U.S. | Effective February 2, 2026 |
| FDA cGMP (21 CFR 210, 211) | Drug manufacturing practice | Pharma makers | Documented, validated processes |
| ISO 14001, 45001 | Environmental, health and safety | Any manufacturer | Often asked for by customers |
Certified processes need documented, repeatable work, which robots and cells support well.
Source: IATF Global Oversight via VDA QMC (23 Apr 2026); FDA QMSR (2026).
Manufacturing was the most ransomware-hit sector in 2025.
Connected machines and old systems widen the attack surface.
1,060
Manufacturing ransomware victims, 2025
14%
Share of all victims, the top sector
+58%
Rise in ransomware victims, 2025
124
Active ransomware groups, a record
Standards and guidance
Basic controls
- IEC 62443: zones and conduits, security levels SL1 to SL4
- NIST SP 800-82 Rev. 3: guide to operational technology security
- NIST Cybersecurity Framework 2.0 for governance and risk
- Purdue levels guide where firewalls and gateways sit
- Map every asset and separate IT from OT networks
- Control vendor and remote access to machines and robots
- Patch or shield legacy controllers; keep offline backups
A robot on the network is a new endpoint; plan its security before it is commissioned.
Source: GuidePoint Security, 2025 ransomware data via Smart Industry (2026); IEC 62443; NIST.
Robots and automation
Every kind of robot used in manufacturing, what it does well, and where it stops.
Robots are spreading from car plants to every kind of factory.
Global installations doubled in ten years while arm prices fell and AI made harder tasks possible.
603,307
Robots installed worldwide, 2025
5.0M
Robots operating worldwide, 2025
38,000
U.S. installations, 2025 (up 11%)
307
U.S. robots per 10,000 workers, 2025
10.5%
Cobot share of installs, 2023
Why now
The U.S. position
- Chinese light arms cost $15K-30K versus $25K-55K for Japanese and European makers.
- Cobots and no-code programming cut setup time and the need for safety cages.
- AI models for vision and manipulation make less structured tasks feasible.
- China installed 354,000 robots in 2025, 59% of the world; local makers hold 57%.
- U.S. installed about 38,400 robots in 2025 versus 354,000 in China.
- U.S. operating stock was 393,700 in 2024, third behind China and Japan.
- Most U.S. robot hardware is imported from Japan and Europe.
- In 2025 automotive took 13,500 of 38,000 U.S. installs; food grew 30%.
The U.S. is third in robot stock but has the largest room to automate.
Source: IFR World Robotics 2025; IFR U.S. preliminary 2025; EVS Intl price guide (2026).
Eight robot families cover almost every factory task.
Each family trades payload, speed, flexibility and price differently; the rest of Part 5 takes them one by one.
| Family | Payload | Speed or rate | Price (est.) | Typical use |
|---|---|---|---|---|
| Articulated arm (6-axis) | 3 kg to 1,700 kg | Repeatability to ±0.06 mm | $25K-280K arm only | Welding, handling, painting, assembly |
| SCARA | 4-20 kg (Epson GX) | Cycle 0.28-0.42 s | Quote | Fast, precise pick-and-place, small assembly |
| Delta (parallel) | 1-15 kg (ABB) | Up to 100 picks/min | Quote | Food, pharma and electronics packing |
| Cartesian / gantry | Sized by frame | Set by axis drives | Quote | Machine loading, palletizing, 3D printing |
| Collaborative robot | 3-35 kg (UR) | Up to 2.2 m/s (ABB GoFa) | $28K-60K typical | Tending, screwdriving, light palletizing |
| AGV / AMR | 250-1,350 kg (MiR) | 1.5-2.0 m/s (MiR) | Quote | Moving pallets, carts and totes |
| Mobile manipulator | Arm on AMR base | AMR travel plus arm | Quote | Tending and kitting across stations |
| Humanoid | ~25 kg carry (Apollo) | Run time 2-4 h per charge | ~$180-200K or lease | Tote moves, parts feeding (pilots) |
Pick the family by task and volume first, then the brand.
Source: Maker datasheets (Epson, ABB, UR, MiR, KUKA); EVS price guide (2026); Standard Bots (2026); EMSNow.
Articulated arms cover loads from 3 kg to over 1,000 kg.
Six-axis arms from FANUC, ABB, Yaskawa, KUKA, Kawasaki, Nachi, Stäubli and Comau do most heavy factory work.
Light, 3-12 kg
Arm only: ~$25K-55K (JP/EU)
- Yaskawa GP7 (7 kg) and KUKA KR AGILUS class
- Small part handling, light assembly
- Fast and compact; short reach
- Chinese tier-1 arms start near $15K
Mid, 15-50 kg
Arm only: ~$45K-95K
- FANUC M-20iD/35: 35 kg, 1,831 mm reach
- Yaskawa GP20HL: 20 kg, 3,124 mm reach
- Arc welding arms $60K-120K, per resellers
- Machine tending, welding, packing
Heavy, 60-250 kg
Arm only: ~$80K-150K
- KUKA KR 240 R3200 PA: 240 kg, ±0.06 mm
- Yaskawa GP180-120 class: 120 kg
- Palletizing, forging, large part moves
- Needs guarding; foundation and floor load
Super-heavy, 300 kg+
Arm only: ~$130K-280K
- Kawasaki MG10HL: 1,000 kg, 4.0 m reach
- Nachi SC700: 700 kg; KUKA KR 1000 Titan: 1,300 kg
- FANUC M-2000iA/1700: 1,700 kg for car bodies
- Comau Smart5 NJ and Stäubli serve niches
The arm is only 30-40% of a finished cell's cost.
Source: FANUC, KUKA, Yaskawa, Kawasaki, Nachi datasheets; EVS Intl and Standard Bots price guides (2026).
SCARA, delta and cartesian robots win on speed and simplicity.
Each gives up the freedom of a six-axis arm in return for faster cycles, lower cost or larger work areas.
SCARA
Epson, Denso, Yamaha
- Epson GX: 4-20 kg payload, 250-1,000 mm reach
- GX20 cycle 0.42 s (2 kg arc); ±0.025 mm repeat
- Rigid in Z, compliant in XY: ideal for inserting
- Limit: reach and tilt freedom are narrow
Delta (parallel)
ABB FlexPicker, Omron
- ABB IRB 360: 1-8 kg, up to 100 cycles/min
- Work area 800-1,600 mm; IRB 390: 15 kg
- Up to 500 wrapped items/min with multi-picks
- Stainless IP69K washdown option for food
Cartesian / gantry
Linear axes, any builder
- Three linear axes; long strokes, rigid frame
- Scales to large cells and heavy loads
- Simple to program; easy to maintain
- Limit: big footprint and no wrist reach
Choose these when the motion is repetitive and the part stays in one plane.
Source: Epson GX-series pages and GX20B datasheet; ABB IRB 360 and FlexPicker releases; qviro.com.
Cobots trade speed for safety and easy setup.
Also Techman (TM5-900 ~$28K), Doosan (M1013 ~$36K), Franka and Elephant; prices are street estimates.
| Model | Payload | Reach | Speed or price | Best for |
|---|---|---|---|---|
| Universal Robots UR30 | 35 kg | 1,300 mm | Quote | Heavy tending, palletizing |
| Universal Robots UR20 | 25 kg | 1,750 mm | Quote | Long reach, palletizing, welding |
| Universal Robots UR15 | 17.5 kg | 1,300 mm | Quote | Fast mid-payload cells |
| Universal Robots UR3e | 3 kg | 500 mm | Quote | Bench assembly, screwdriving |
| FANUC CRX-30iA | 30 kg | 1,756 mm | Quote | Heavy tending, pick-and-place |
| ABB GoFa CRB 15000 | 5-12 kg | 950-1,620 mm | Up to 2.2 m/s | Tending, assembly |
| ABB SWIFTI CRB 1100 | 4 kg | 475-580 mm | Up to 5 m/s | Fast small-part work |
| Standard Bots Core | 18 kg | 1.3 m | From $39,500 | Tending, palletizing |
Cobots were 10.5% of 2023 installs; UR has sold over 100,000.
Source: Universal Robots (2025 media kit); FANUC America; ABB (2025); Standard Bots (2026); IFR (2023 data).
AMRs replaced fixed-path AGVs for most new material moves.
AGVs follow wires or tape; AMRs map the floor and route around obstacles and people.
| Vendor | Models | Payload | Speed | Scale or notes |
|---|---|---|---|---|
| MiR (Teradyne) | MiR250, MiR600 | 250 kg, 600 kg | 2.0 m/s | Shelf, cart and hook top modules |
| MiR (Teradyne) | MiR1200, MiR1350 | 1,200 kg, 1,350 kg | 1.5 m/s | Autonomous pallet jacks |
| Seegrid | Lift EL1, RS1, CR1 | 1,225-1,814 kg | Not listed | 2,500+ AMRs at 200+ sites |
| Seegrid | Tow Tractor S7 | 4,536 kg tow | Not listed | No recordable incidents claimed |
| Locus Robotics | LocusBot | Totes and cases | Not listed | 6B picks; 150+ customers, 350+ sites |
| Geek+ | Goods-to-person | Shelves, totes | Not listed | H1 2025 revenue RMB 1.0B, up 31% |
| OTTO, Vecna, Zebra Fetch | Pallet, tow, cart | Per model | Not listed | Rockwell owns OTTO |
| BlueBotics | ANT navigation | Software | Not listed | Lets other OEMs build AGVs |
Choose by load and route: pallets favor MiR and Seegrid; picking favors Locus and Geek+.
Source: MiR product overview (2025); Seegrid website; Locus Robotics (Oct 2025); Geekplus interim results (2025).
Mobile manipulators put an arm on a self-driving base.
They tend several machines or kit parts across stations, but each stop adds positioning error to manage.
What they do and who makes them
Strengths and limits
- KUKA KMR iiwa pairs a lightweight arm with a mobile platform; sales began in 2018.
- Neura Robotics demonstrates end-to-end mobile manipulation in intralogistics.
- Typical jobs: machine tending across cells, kitting, tote and part replenishment.
- One robot serves several stations, so the arm is paid for once.
- NVIDIA Isaac and vision AI are making unfixtured picks reliable.
- Strength: reaches work that fixed cells cannot, without moving machines.
- Limit: a docked base is less accurate than a bolted arm; vision corrects it.
- Limit: slower than fixed cells because it drives, docks and re-localizes.
- Limit: battery, floor flatness and wifi must be managed on every route.
- Safety combines AMR rules (ISO 3691-4, ANSI R15.08) with arm rules (ISO 10218).
- Best fit: low to mid volume, high mix, labor-short tending tasks.
Think of it as a worker who walks between machines.
Source: KUKA press (2018); NVIDIA CES 2026 release; Seegrid (R15.08 reference).
Humanoids in factories are mostly pilots with a few paid fleets.
Status verified to November 2026; announcements are separated from work that is actually running.
| Maker and model | Site | Status | Evidence |
|---|---|---|---|
| Figure 02, then 03 | BMW Spartanburg | Pilot ended; F.03 arrived Jun 2026 | F.02: 11 months, 1,250+ h, 90,000 parts loaded |
| Agility Digit | GXO (Georgia); Toyota Woodstock | Paid fleets (RaaS) | GXO 100,000+ totes; Toyota: 7 robots, 3 first |
| Apptronik Apollo | Mercedes, GXO, Jabil | Pilots | Tested in Mercedes plants; $520M raised Feb 2026 |
| Boston Dynamics Atlas | Hyundai Metaplant, Georgia | Training center opened Sep 2026 | Plant fleet planned from 2028 |
| Tesla Optimus | Tesla Fremont | Early ramp, internal use | No rate, price or outside sales disclosed |
| UBTech Walker S2 | Chinese auto and EV plants | Deliveries began Nov 2025 | 800M+ yuan orders, company claim |
| Unitree G1, H2 | Mostly research and schools | Industrial 9% of shipments | ~5,500 humanoids shipped in 2025 |
About 20,000 humanoids shipped in 2025; roughly 10% did real work.
Source: BMW (2024); Figure (2026); Agility (Oct 2026); Tesla Q3 2026; UBTech (Nov 2025); Robotics 24/7; Apptronik.
Storage systems and palletizers automate both ends of the line.
AS/RS stores and retrieves goods by machine; palletizers stack finished cases for shipping.
$1.4B
Robotic palletizer market, 2024
$1.9B
Palletizer market forecast, 2029
5.9%
Palletizer growth rate per year
6B
Picks by Locus robots, Oct 2025
AS/RS and warehouse automation
Palletizing options
- AutoStore cube storage; AutoCase first deployed at Nowaste Logistics in Sep 2026.
- Swisslog launched AgileStore pallet shuttle (Feb 2026) and FastMove monorail (Jul 2026).
- Swisslog IntraMove AMRs move pallets (Aug 2025); Medline runs AutoStore with Swisslog.
- Symbotic and Dematic build large case and pallet systems.
- Arms from FANUC, KUKA and ABB lead the palletizer market, with KION and Krones.
- Cobot palletizers (UR30, OnRobot kits) suit lower volume lines.
- Gantries stack at high speed on dedicated lines.
- Layer grippers move whole layers; vacuum grippers move single cases.
Palletizing is the most common first robot for a plant new to automation.
Source: MarketsandMarkets (2024); Locus Robotics (Oct 2025); Automated Warehouse (2025-26); OnRobot.
Inspection robots and exoskeletons extend people, not replace them.
Legged robots and drones walk and fly routes; exoskeletons reduce strain for people lifting all day.
Legged robots
Spot, ANYmal
- Spot: ~$74,500 base, 14 kg payload, 90 min
- Spot IP54, 1.6 m/s; Spot Arm lifts 11 kg
- ANYmal X: IP67, Zone 1 certified, 2-4 h
- Gauge reading, thermal scans, gas leaks
Inspection drones
Skydio X10 and others
- Skydio X10: up to 40 min, 45 mph top speed
- Radiometric thermal camera, six nav lenses
- Deploys in under 40 seconds from a case
- Roofs, stacks, tanks, lines, perimeters
Exoskeletons
Ottobock, German Bionic, Sarcos
- German Bionic Exia: up to 38 kg lift support
- Ottobock Paexo: passive shoulder and neck aids
- Sarcos Guardian XO: full-body powered unit
- Powered ones are heavier; battery up to 8 h
These tools raise safety and uptime, not headcount cuts.
Source: Standard Bots Spot guide (2026); Oxmaint comparison (2026); Skydio X10; German Bionic; Robot Report (Sarcos).
The gripper decides what a robot can actually pick up.
Robot hands are mostly bought from specialists, not the robot maker; price is by quote.
| Type | Makers | Example spec | Best for |
|---|---|---|---|
| Parallel electric gripper | Robotiq, OnRobot, Schunk, Zimmer | Robotiq 2F-85: 85 mm, 5 kg, 20-235 N | Cobot tending, assembly |
| Wide-stroke gripper | Robotiq, OnRobot | 2F-140: 140 mm stroke, 2.5 kg | Larger parts, trays |
| Adaptive gripper | OnRobot RG6 | 6 kg force-fit, 10 kg form-fit, 160 mm | Mixed part sizes |
| Vacuum cups, pumps | Schmalz, Piab | Ejectors or electric pumps; bellows cups | Boxes, sheets, bags |
| Soft or compliant | Soft Robotics | Soft fingers conform to the item | Food, produce, fragile parts |
| Tool changers, tools | OnRobot, Schunk | Screwdrivers, sanders, sensors | One arm, many tasks |
Match the gripper to the part, not to the robot brand.
Source: Robotiq and OnRobot product pages (2026); Schmalz vacuum catalog; Soft Robotics.
Controllers, vision and AI models now work as one stack.
The controller still runs the motion; foundation models add perception and task planning above it.
AI foundation models Cloud/edge
Vision-language-action models plan and adapt tasks
Models and status, Nov 2026
- NVIDIA Isaac GR00T N1.6: open VLA model for humanoids (Jan 2026).
- GR00T N2 previewed Mar 2026; launch targeted end of 2026.
- Gemini Robotics-ER 1.5: preview via API; Apptronik among 60+ testers.
- Physical Intelligence (pi0) and Skild AI build general robot models.
- ABB, FANUC, KUKA, UR and YASKAWA build on NVIDIA Isaac.
Simulation and training NVIDIA
Isaac Sim, Isaac Lab 3.0, Cosmos world models
Perception and vision Sensors
2D/3D cameras, pose estimation, inspection AI
Robot controller Real time
FANUC R-30iB Plus, KUKA, ABB, UR PolyScope X
Drives, motors, safety Hardware
Servo amplifiers, encoders, safety PLC and scanners
Foundation models are early; controllers still carry the safety function.
Source: NVIDIA CES and GTC 2026 releases (SiliconANGLE); InfoQ (Sep 2025); FANUC controller datasheets.
Welding is a top robot job, and cobots are entering.
Arc, spot and laser welding differ in process and volume, and new vision-guided cells target low-volume shops.
Arc welding
MIG and TIG seams on steel and aluminum
- Arm, torch, wire feeder and positioner form one cell
- Common in fabrication, trailers, structures and machinery
- Needs repeatable part fit-up and fixtures
- AWS D16.1 covers safety of robotic arc welding
Spot welding
Resistance welds on stacked sheet metal
- Core process in automotive body-in-white lines
- A servo gun clamps the sheets and passes current
- Heavy-payload arms carry the weld gun
- Cycle time and repeatability matter more than flexibility
Laser welding
Fast, narrow seams with low heat input
- Used on battery packs, car bodies and thin-gauge parts
- Joint fit-up tolerances are tight
- Needs a laser-safe enclosure
- Higher capital cost, shorter cycle than arc
Cobot and AI welding
Low-volume, high-mix fabrication
- Novarc pipe cobot: one joint cut from 4.5 hours to 40 minutes
- Path Robotics reports over $100M in 2025 bookings
- Raymath reports 4x productivity from four UR cobots
- Aim: add capacity as skilled welders retire
Welding was 15% of the global robot stock in 2024; AWS projects 320,500 new welders needed by 2029.
Source: IFR via Statista (2024); AWS Foundation/Lightcast (2025); OSHA; Novarc; Path Robotics (Jan 2026); Universal Robots.
Assembly and machine tending free people for judgment work.
These jobs are repetitive, ergonomic or tied to machine uptime, so they suit arms, SCARA robots and cobots.
Assembly share of robot stock
Assembling was about 10% of the global robot stock in 2024; SCARA robots lead small parts.
Robotic screwdriving
A cobot with a feeder and torque-controlled driver logs torque and angle for every screw.
Machine tending
A robot loads and unloads CNC mills, lathes, presses and molding machines so spindles keep cutting.
CNC tending in job shops
A cobot on a cart moves between machines; fixtures and part presentation decide the payback.
Unmanned running
Robots work through breaks and unmanned shifts when parts, tools and fixtures are staged in advance.
Loading at BMW Spartanburg
Figure 02 loaded sheet metal onto a weld fixture: 90,000+ parts in an 11-month deployment (2025).
In assembly and tending, fixtures, part feeding and gripper design decide success more than the arm.
Source: IFR via Statista (2024 stock); Figure AI (Nov 2025); Wikipedia, Industrial robot (accessed Nov 2026).
Painting is mature; sanding and polishing are catching up.
Coating and bead jobs are stable and repeatable. Finishing varies part by part and needs force control.
Painting and dispensing
Sanding, deburring, polishing
- Paint arms are sealed for solvent atmospheres and use rotary atomizers in booths
- Robots keep workers out of fumes and overspray
- Dispensing covers sealer, adhesive, glue and gasket beads
- Vision and flow control keep bead size steady
- Mercedes-Benz Juiz de Fora applies stringer glue with a UR cobot (2025)
- Assars uses a UR cobot for powder coating (2026)
- Work is dusty, loud and repetitive, and hard to staff
- Force-controlled arms hold constant contact pressure on the part
- Compliant tools absorb part-to-part variation
- High-mix work needs paths generated from CAD or 3D scans
- Abrasives wear, so cells must track consumables and recalibrate
- THEMAGIC5 trims swim goggle gaskets with a UR cobot (2026)
Dispensing and coating pay back on consistency and material savings; finishing pays back on labor.
Source: Universal Robots case stories (2025-2026); OSHA robotics guidance; Wikipedia, Industrial robot (accessed Nov 2026).
Handling is the largest robot job, from the belt to the pallet.
Picking, packing, casing and palletizing form one chain, and mobile robots carry the result onward.
Pick
Vision-guided delta robots or arms pick loose product from a belt or bin.
Pack
Cartesian robots and cobots place items into trays, cartons and bags.
Case
Cases are formed, filled, sealed and labeled, with robots feeding the machines.
Palletize
Arms or gantries stack cases in a set pattern, often with layer pickers.
Move
AMRs and AGVs take pallets to wrapping, storage or the truck dock.
51%
Handling share of robot stock, 2024
1M+
Robots across Amazon's network
75%
Amazon Sequoia speed-up claim
7,212
Cobots ordered in N. America, 2025
Palletizing is often the first cell a plant buys because payloads, patterns and safety are well understood.
Source: IFR via Statista (2024); Amazon (2024, updated 2026); A3 (Feb 2026).
Inspection robots turn quality checks into data for every part.
Vision, force and measurement sensors check parts at line speed, and the results feed the process.
- Cameras
- 2D, 3D and thermal imaging
- Robot or fixed station
- Moves sensor or part
- Machine vision
- Measures features and defects
- Accept or reject
- Part routed on the line
- Touch and force
- Probes and force sensors
- AI defect model
- Learns from labeled images
- Pass or fail logic
- Limits set by quality plan
- Rework loop
- Defects sent back
- Part definition
- CAD, tolerances, specs
- Traceability record
- Serial number and result
- Quality data
- Trends and process drift
- Process signals
- Weld current, torque, temperature
The best return comes from catching process drift early, before scrap builds up.
Japanese and European makers lead; Chinese brands are rising.
Industrial robot installations were worth $18.6B in 2025; most U.S. robots are imported from Japan and Europe.
| Maker | Home base | What to know | Note |
|---|---|---|---|
| FANUC | Japan | Arms, cobots (CRX), paint, SCARA and delta robots | Broadest line of a single maker |
| Yaskawa (Motoman) | Japan | Welding, packaging, assembly, coating and handling | Strong in arc welding cells |
| ABB Robotics | Switzerland | $2.3B revenue (2024); 300,000+ robots installed | Sale to SoftBank agreed Oct 2025, $5.4B |
| KUKA | Germany | Owned by Midea; group revenue EUR 3.9B (2025) | Body-shop work; Toledo, Ohio plant |
| Universal Robots | Denmark | Cobot pioneer; UR20 and UR30 heavy cobots | Owned by Teradyne since 2015 |
| Estun, Inovance, Efort, Siasun | China | Chinese domestic brands | 55% of China's installs in 2025 |
| U.S. makers | United States | Several have emerged in recent years | Most U.S. robots still imported |
Chinese brands installed 195,000 robots at home in 2025, a 55% share, down from 57% in 2024.
Source: IFR World Robotics 2026 (Sep 2026); Wikipedia pages for ABB Robotics, KUKA, Universal Robots (accessed Nov 2026).
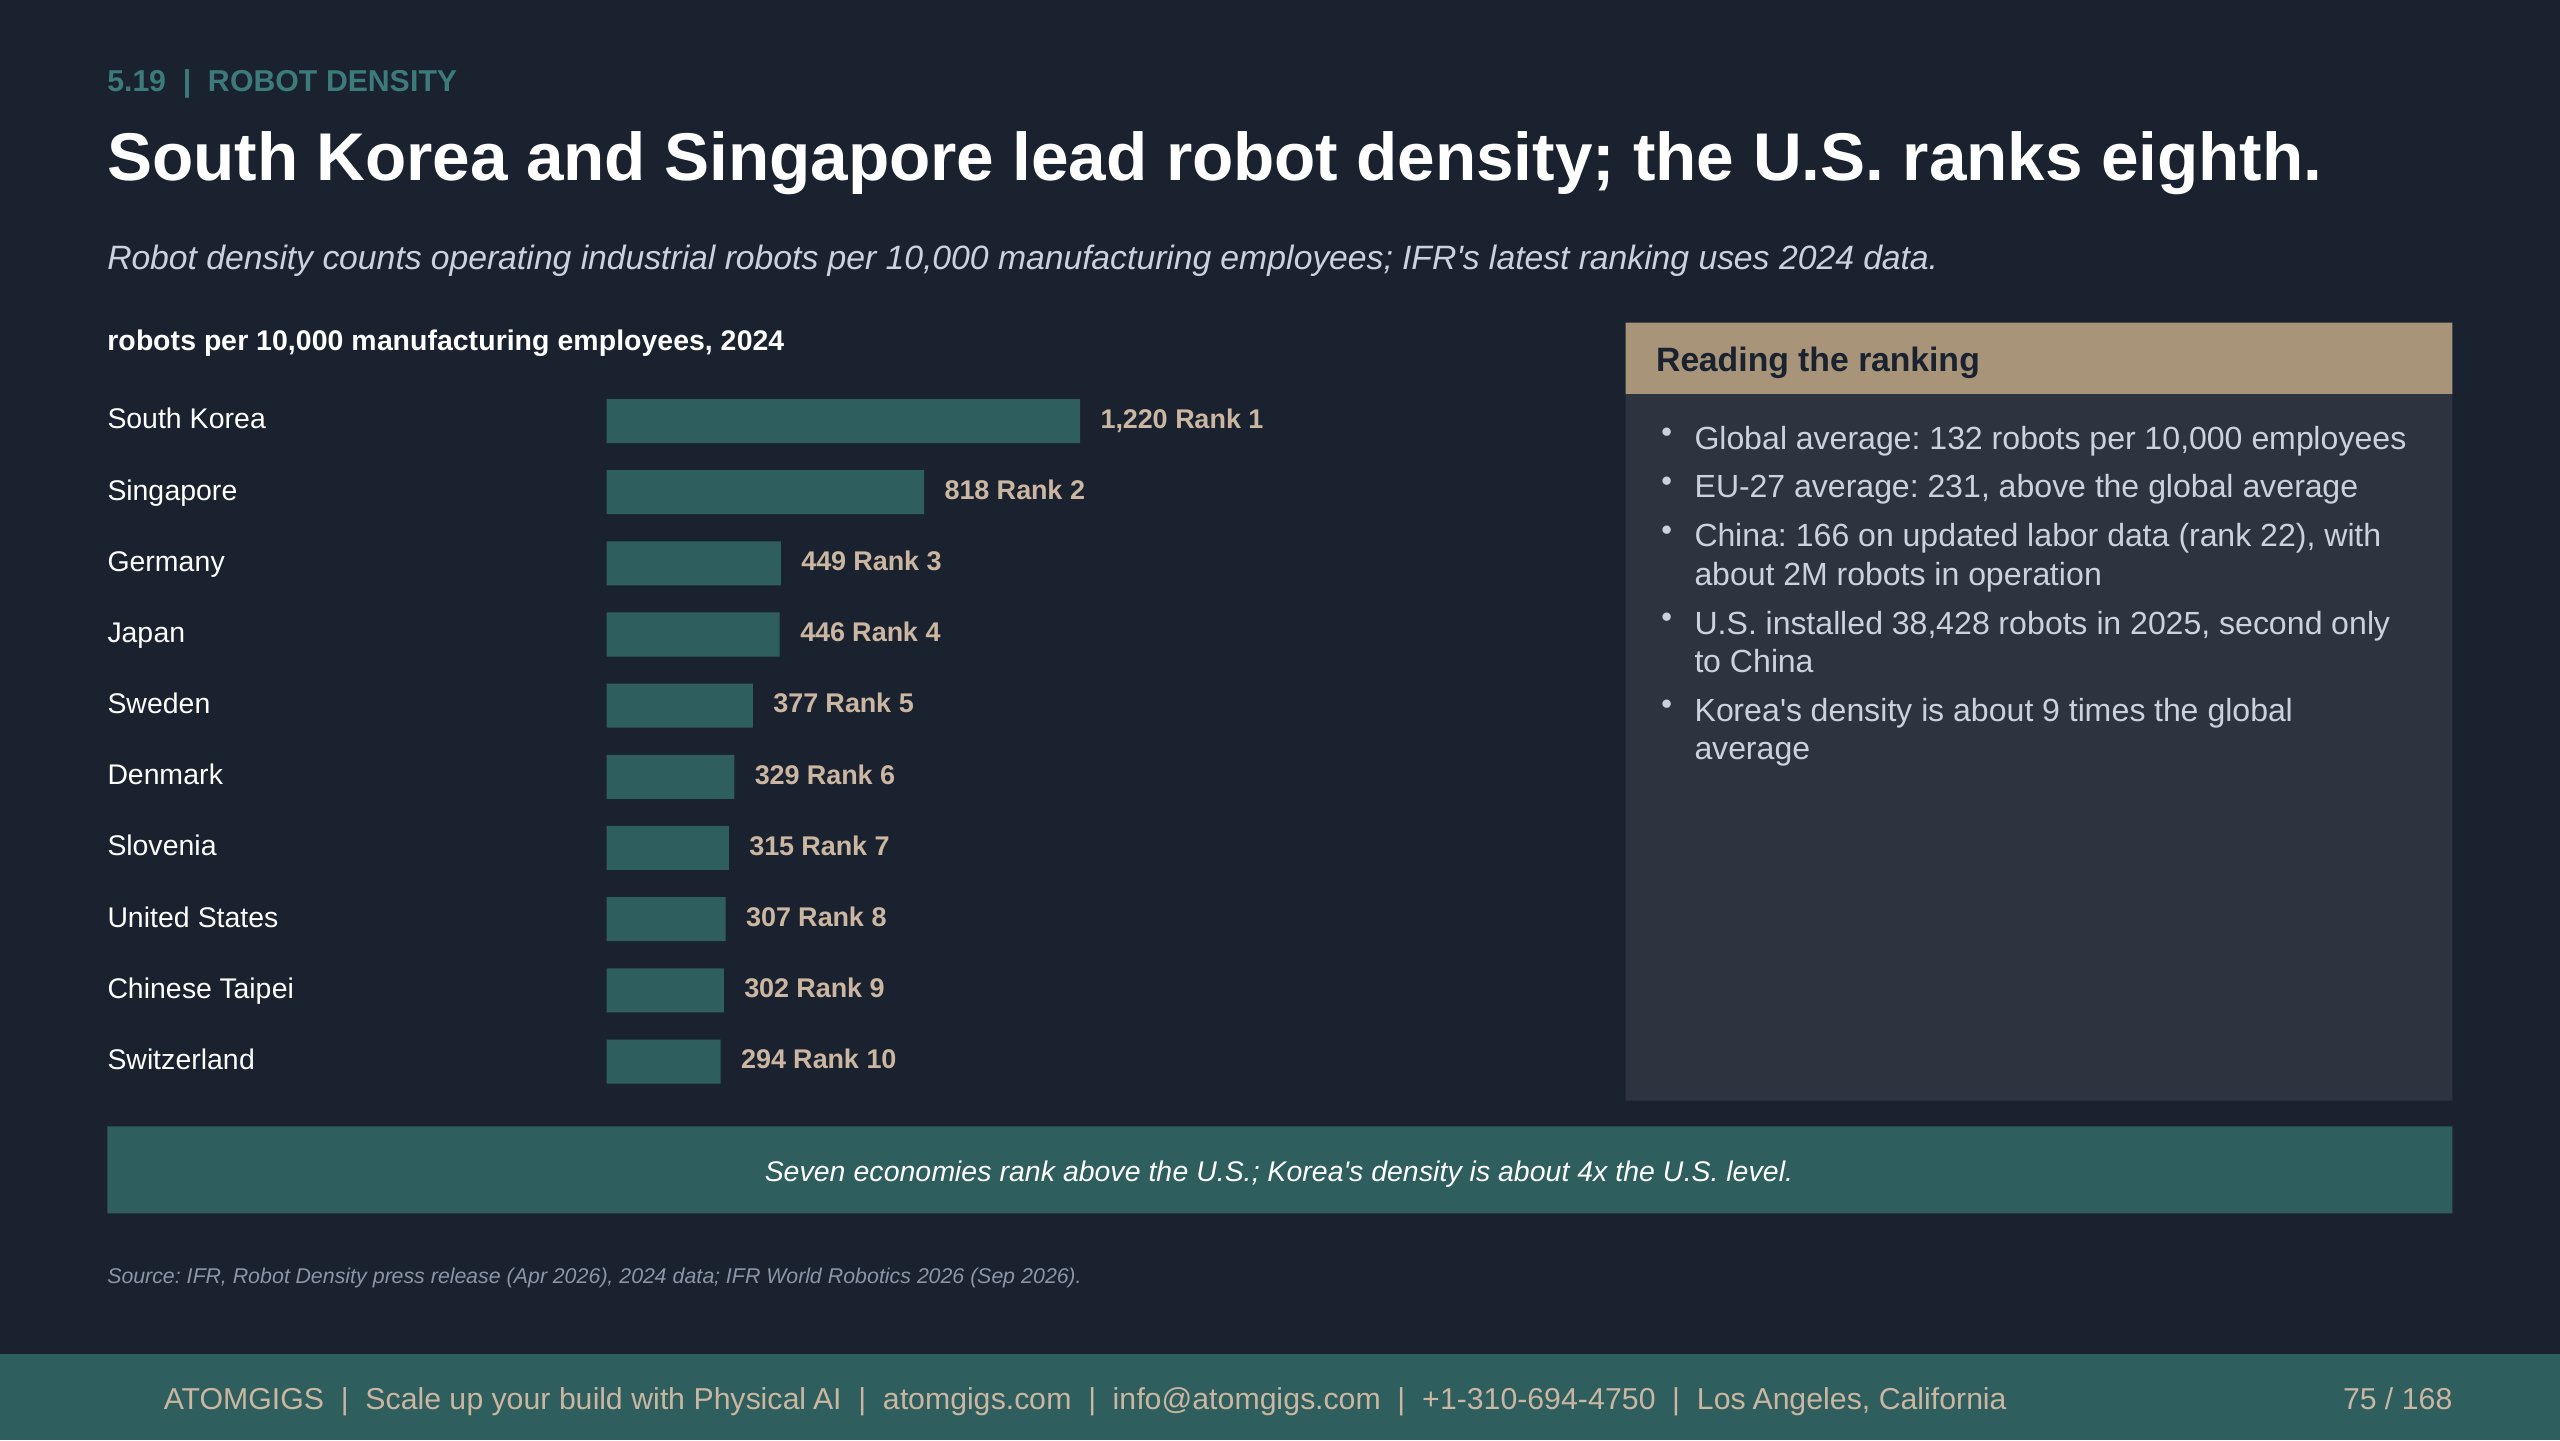
South Korea and Singapore lead robot density; the U.S. ranks eighth.
Robot density counts operating industrial robots per 10,000 manufacturing employees; IFR's latest ranking uses 2024 data.
Text version
robots per 10,000 manufacturing employees, 2024
Reading the ranking
South Korea
1,220 Rank 1
- Global average: 132 robots per 10,000 employees
- EU-27 average: 231, above the global average
- China: 166 on updated labor data (rank 22), with about 2M robots in operation
- U.S. installed 38,428 robots in 2025, second only to China
- Korea's density is about 9 times the global average
Singapore
818 Rank 2
Germany
449 Rank 3
Japan
446 Rank 4
Sweden
377 Rank 5
Denmark
329 Rank 6
Slovenia
315 Rank 7
United States
307 Rank 8
Chinese Taipei
302 Rank 9
Switzerland
294 Rank 10
Seven economies rank above the U.S.; Korea's density is about 4x the U.S. level.
Source: IFR, Robot Density press release (Apr 2026), 2024 data; IFR World Robotics 2026 (Sep 2026).
Electronics and automotive take nearly half of all new robots.
Metals and machinery is growing fastest, while food, life sciences and semiconductors lead U.S. demand growth.
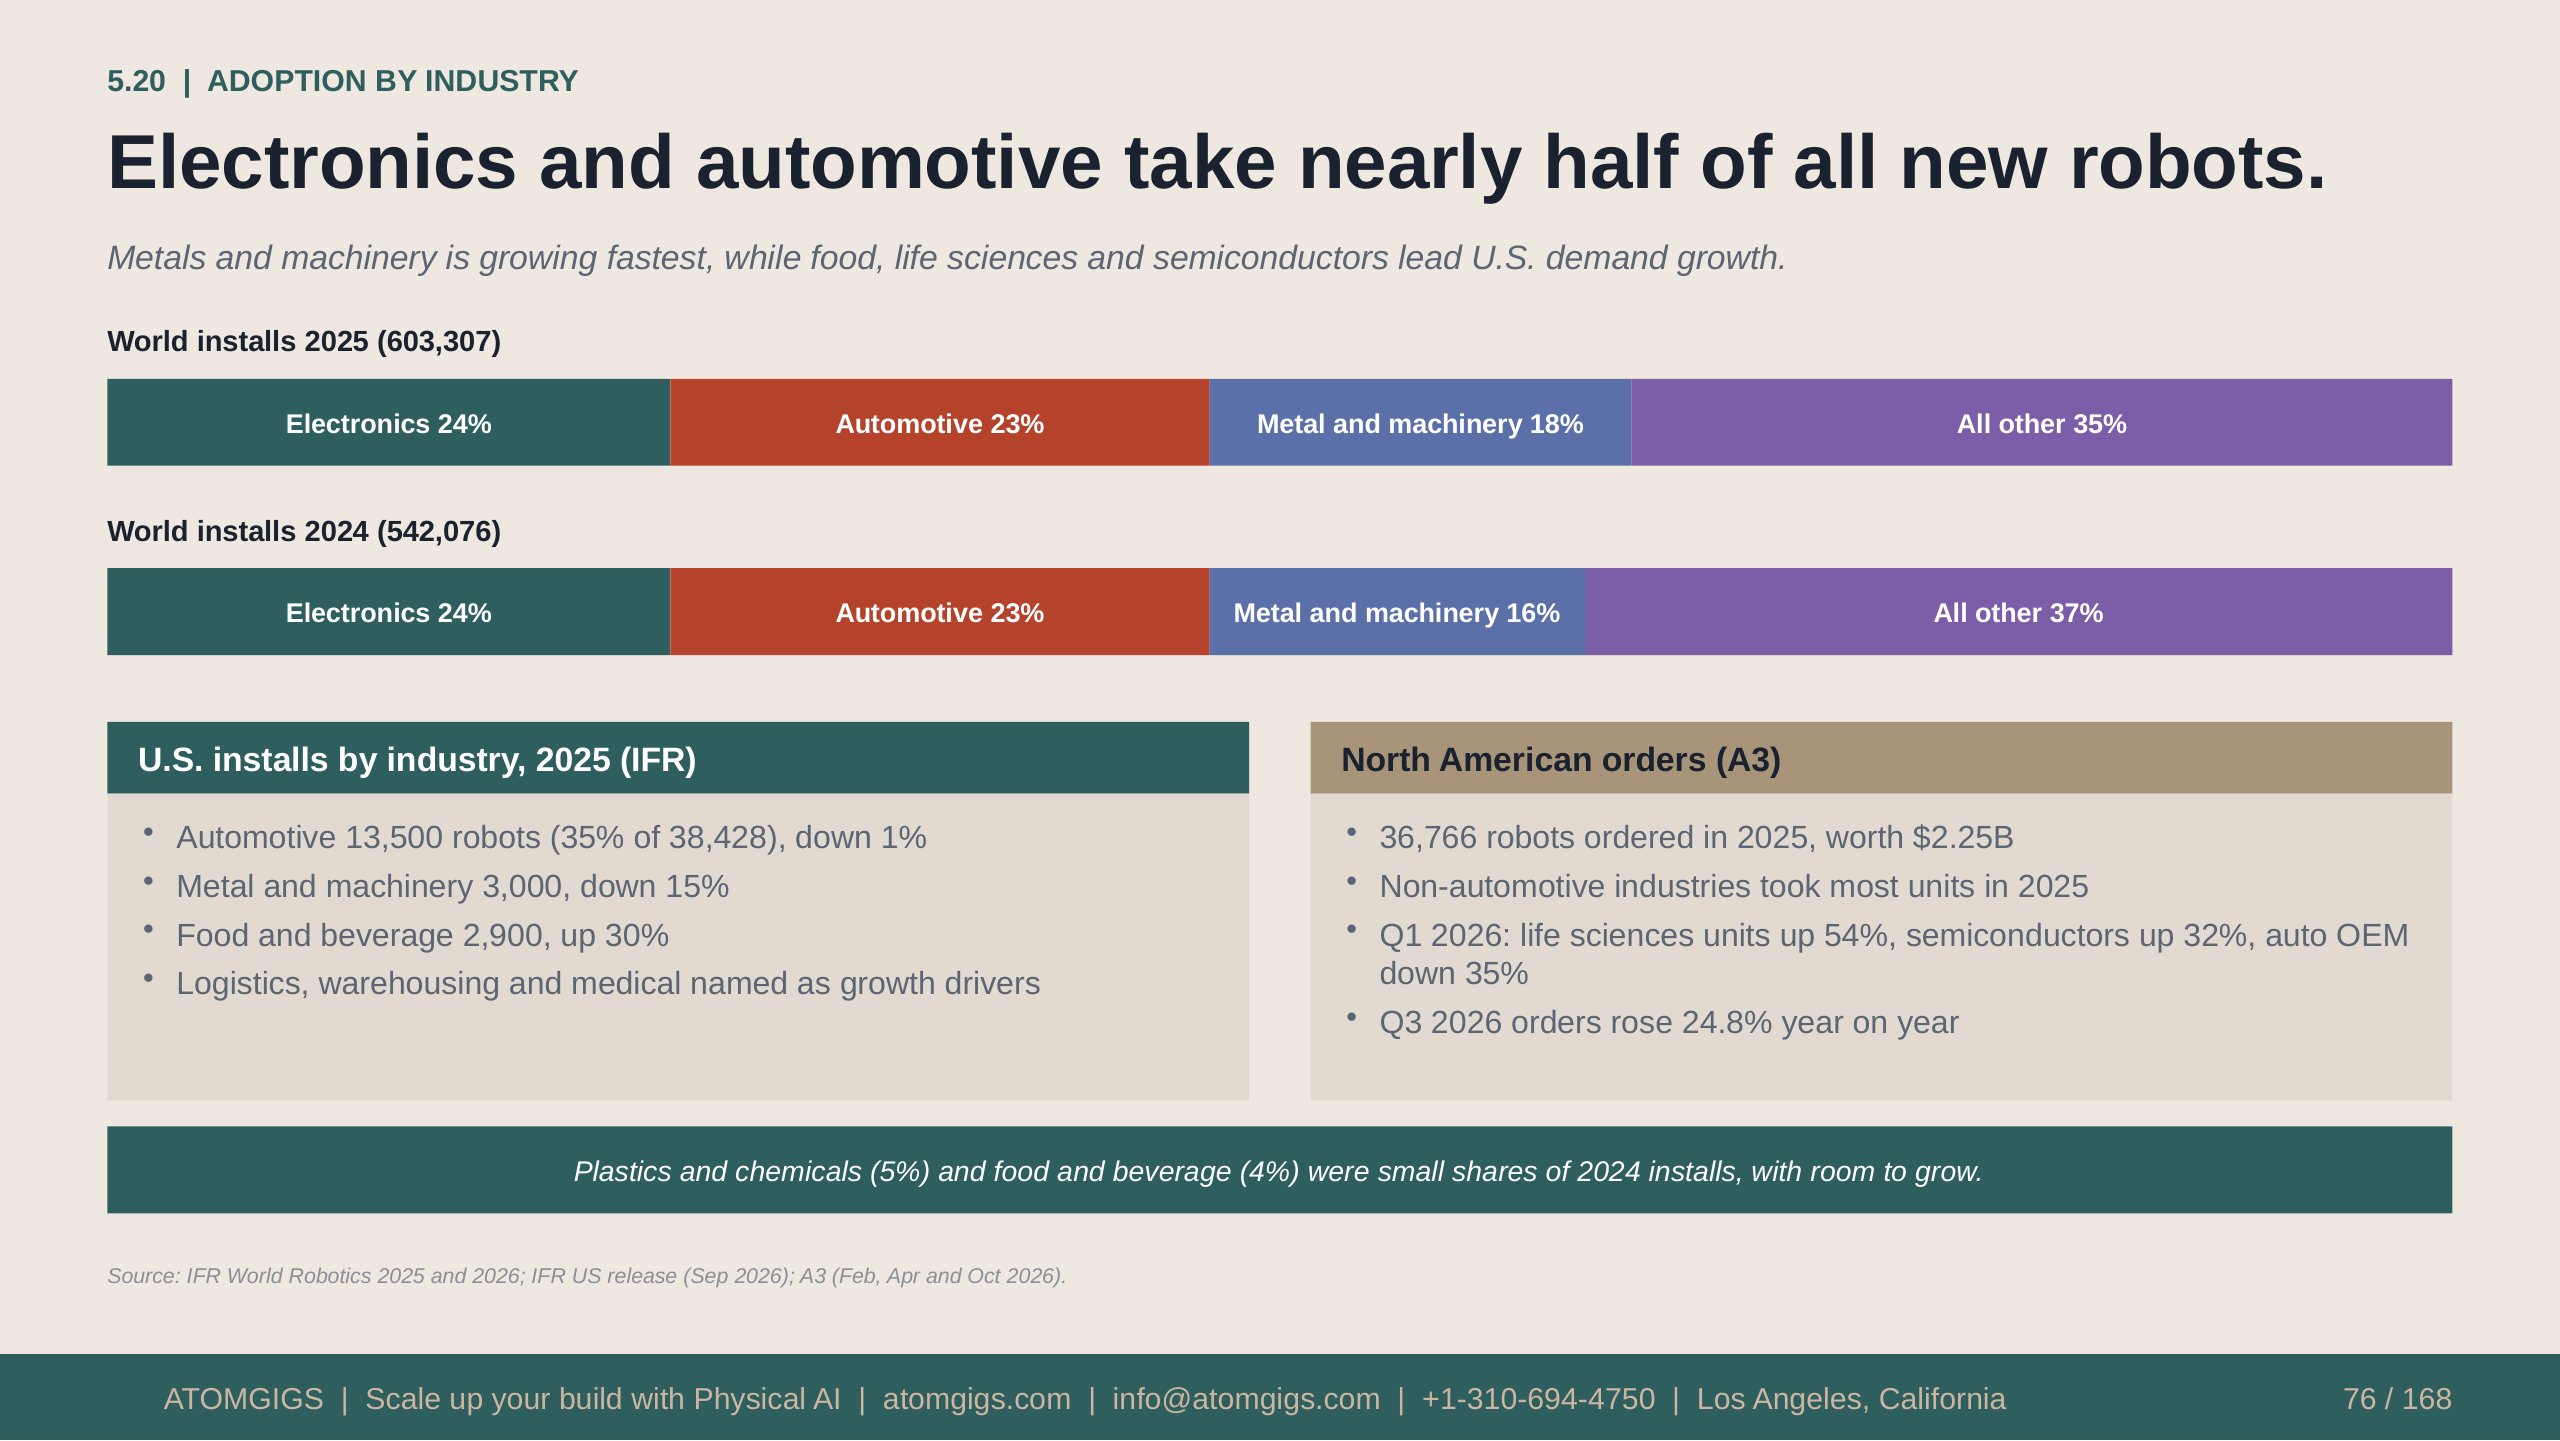
Text version
World installs 2025 (603,307)
Electronics 24%
Automotive 23%
Metal and machinery 18%
All other 35%
World installs 2024 (542,076)
Electronics 24%
Automotive 23%
Metal and machinery 16%
All other 37%
U.S. installs by industry, 2025 (IFR)
North American orders (A3)
- Automotive 13,500 robots (35% of 38,428), down 1%
- Metal and machinery 3,000, down 15%
- Food and beverage 2,900, up 30%
- Logistics, warehousing and medical named as growth drivers
- 36,766 robots ordered in 2025, worth $2.25B
- Non-automotive industries took most units in 2025
- Q1 2026: life sciences units up 54%, semiconductors up 32%, auto OEM down 35%
- Q3 2026 orders rose 24.8% year on year
Plastics and chemicals (5%) and food and beverage (4%) were small shares of 2024 installs, with room to grow.
Source: IFR World Robotics 2025 and 2026; IFR US release (Sep 2026); A3 (Feb, Apr and Oct 2026).
Four deployments show real gains, mostly vendor-reported.
Each case below names its source; outcomes come from the company or vendor and are not independently audited.
BMW Spartanburg
Humanoid loads sheet metal, 2025
- Figure 02 placed parts on a weld fixture; six-axis robots welded
- 11 months, 10-hour shifts, Monday to Friday
- 90,000+ parts loaded across 1,250+ runtime hours
- Parts fed 30,000+ BMW X3 vehicles
Amazon fulfillment
1 million+ robots since 2012
- Fleet grew from the 2012 Kiva Systems acquisition
- Sequoia identifies and stores inventory up to 75% faster
- Vulcan picks and stores about three quarters of item types
- All figures are Amazon's own claims
Seaspan drydock
Novarc pipe-welding cobot, Vancouver
- Ship repair yard with tight retrofit deadlines
- One pipe joint fell from about 4.5 hours to 40 minutes
- Productivity up over 400%; work no longer outsourced
- Welders run it without programming
Raymath
Four UR cobot welders
- CEO programmed 20 weld points in four hours
- Four cells need half the operators and weld twice as fast
- Universal Robots reports 4x productivity
- A partner customer; vendor-reported results
Gains are largest where robots take one narrow task and people keep the judgment calls.
Source: Figure AI (Nov 2025); Amazon (2026); Novarc/Seaspan case study; D Business on Universal Robots (2022).
Robot safety rests on risk assessment and a stack of standards.
The 2025 revision of ISO 10218 reset the baseline; U.S. practice follows ANSI/A3 R15.06-2025.
Law and OSHA U.S. law
No robot-specific OSHA rule; guarding, lockout apply
What changed in 2025
- Part 2 absorbs the collaborative rules of ISO/TS 15066
- Four collaborative modes: stop, hand guiding, separation, force limiting
- New cybersecurity requirements for robot safety
- 'Collaborative application' replaces 'collaborative robot'
- OSHA general duty clause still applies to every employer
Robot standards Core
ISO 10218-1 and -2:2025; ANSI/A3 R15.06-2025 (3 parts)
Collaborative and mobile Application
ISO/TS 15066; A3 R15.08 and ISO 3691-4 for AGVs and AMRs
Functional safety Controls
ISO 13849-1, IEC 62061: safety function reliability
Risk assessment Every site
ISO 12100 method; assess every cell before use
A cobot is only as safe as the application: tool, payload, speed and layout all enter the risk assessment.
Source: A3 ISO 10218 FAQ and standards page (2025); ISO (2025); OSHA robotics standards page (accessed Nov 2026).
Integration can cost as much as the robot, and cells need operators.
Integrators design, build and commission cells; operating and supervising them afterward is a separate need.
5.08M
Robots operating worldwide, 2025
38,428
Robots installed in the U.S., 2025
1x-3x
Integration vs. robot cost (rule of thumb)
320,500
New welders needed by 2029 (AWS)
What integrators do
The gap Atomgigs targets
- Design the cell, tooling, safeguarding and controls around the robot
- Program, commission and validate to ISO 10218-2 and R15.06
- Most U.S. robots are imported; domestic integrators implement them
- Hundreds of integrators belong to CSIA, and A3 lists member firms
- Small plants often lack staff to run, tune and supervise a new cell
- Skilled labor is scarce and aging, as in welding
- Atomgigs does not replace integrators; it complements them
- It sources robots, supplies vetted crews and operates the fleet after startup
The robot is the smaller part of the project; design, safety and daily operation make up the rest.
Source: IFR World Robotics 2026; AWS Foundation/Lightcast (2025); CSIA (2026). The 1x-3x range is an industry rule of thumb.
Design, build and digital twins
How a plant or line goes from concept to stable output, and how digital twins de-risk it.
Every plant plan starts with demand and ends with a budget.
Planning turns a product forecast into capacity, layout, equipment, utilities and a people plan, in that order.
- Demand forecast
- Volume, mix, seasonality
- Concept design
- Layout and process flow
- Product design
- BOM, tolerances, variants
- Capacity and takt
- Machines and shifts needed
- Layout and flow
- Material and people paths
- Capex budget
- Building, equipment, ramp
- Site constraints
- Land, power, water
- Process and equipment
- Make-or-buy per step
- Building and utilities
- Power, air, water, HVAC
- Master schedule
- Long-lead items first
- Capital envelope
- Budget and return hurdle
- Automation level
- Manual to lights-out
- Workforce plan
- Skills, shifts, training
- Strategy
- Make, buy, automate
- Risk register
- Supply, permits, skills
Fixing a layout on paper costs far less than moving a machine after install.
Atomgigs synthesis of standard plant-planning practice.
Automation projects pass six gates from concept to ramp-up.
Each gate has an exit test; skipping simulation and acceptance testing moves the cost of errors to the shop floor.
Concept and design
Define scope, cycle time, layout, safety concept and budget.
Simulate
Test robot reach, cycle time, collisions and PLC logic in a virtual model.
Build
Fabricate fixtures and panels, program robots and PLCs at the integrator.
Factory acceptance test: run the cell at the builder against agreed criteria.
Ship and install
Ship, set, level, wire and connect to plant power, air and network.
SAT and ramp-up
Site acceptance test, operator training, then ramp to rated rate.
70%
Less on-site commissioning (Wipro PARI)
3 days
BMW virtual collision check, vs ~4 weeks
~24 mo
Hyundai Georgia plant, ground to first car
Time saved in virtual commissioning is time taken off the physical critical path.
Siemens Tecnomatix (Wipro PARI case); BMW Group (2025); Georgia Dept. of Economic Development.
Delivery models differ mainly in who carries design and cost risk.
The owner chooses how much to hand to one party and how much to manage directly.
| Model | How it works | Risk sits with | Best fit |
|---|---|---|---|
| EPC (turnkey) | One contractor engineers, procures and builds for a set scope | Contractor (fixed price) | Well-defined plants, owners with thin teams |
| EPCM | Manager runs design and procurement; owner contracts the trades | Owner | Complex or phased plants, owner wants control |
| Design-build | One entity holds design and construction under one contract | Shared, mostly builder | Buildings and shells on a fast schedule |
| Turnkey integrator | Integrator delivers a complete line or cell, FAT to SAT | Integrator for the cell | Automation lines inside an existing plant |
| In-house / owner-managed | Owner engineers, buys and coordinates trades directly | Owner | Large OEMs with deep engineering teams |
Pick the model before design starts; changing it mid-project resets cost and schedule risk.
Industry practice; see AGC and construction-law summaries of EPC, EPCM and design-build.
Simulation and balancing find the bottleneck before steel is cut.
Models test flow, robot reach and control logic; balancing spreads work so no station limits the line.
Simulation tools by job
Line balancing in four steps
- Siemens Tecnomatix Process Simulate: robot paths, assembly and virtual commissioning
- Siemens Plant Simulation: material flow and throughput of whole lines
- Dassault DELMIA: process planning and virtual twin on the 3DEXPERIENCE platform
- Visual Components: robot cell layout and offline programming
- FlexSim and AnyLogic: discrete-event models of flow, queues and logistics
- NVIDIA Omniverse: physics-based facility models and multi-robot fleet tests
- Set takt time: available production time divided by customer demand
- List every task and its time, with precedence rules
- Assign tasks to stations so each stays at or below takt
- Find the slowest station; cut its time or split its work
- Re-run after every product mix or demand change
A line runs at the pace of its slowest station, not its average one.
Vendor documentation (Siemens, Dassault, Visual Components, FlexSim, AnyLogic, NVIDIA); standard industrial engineering.
A new plant takes two to three years from groundbreaking to output.
Large U.S. projects show about two years to first product on fast tracks and about three on complex ones.
Site and permits
Design and procure
Site and shell
Utilities and fit-out
Equipment install
Land, zoning, environmental and utility agreements.
Engineering, bids and orders for long-lead gear.
Grading, foundations, steel, roof and slab.
Power, compressed air, water, HVAC, process piping.
Set machines and lines, connect, then commission.
~24 mo
Hyundai Georgia: Oct 2022 to Oct 2024
~3 yrs
Toyota N.C. battery: 2022 to Jun 2025
~38 mo
U.S. chip fab incl. permits (Exyte)
Permitting and design can take as long as construction itself on complex sites.
Georgia Dept. of Economic Development; Toyota pressroom; Exyte via Tom's Hardware (2025).
Electrical gear now sets the schedule for many new plants.
Order transformers and switchgear at concept stage; machines and robots can usually follow.
| Item | Reported lead time | Source and date |
|---|---|---|
| Power transformers | About 128 weeks on average | Wood Mackenzie, Q2 2025 |
| Generator step-up transformers | About 144 weeks on average | Wood Mackenzie, Q2 2025 |
| Switchgear (all voltages) | About 44 weeks on average | Wood Mackenzie, Q2 2025 |
| MV switchgear (15 kV) | 52 to 80 weeks | Terrapin Consulting Group, 2026 |
| Pad-mount transformers (0-5 MVA) | 40 to 65 weeks | Terrapin Consulting Group, 2026 |
| Diesel generators (1.5-3 MW) | 50 to 78 weeks | Terrapin Consulting Group, 2026 |
| Robots, CNC machines, conveyors | Quote-specific; get ship dates in writing | Vendor confirmation |
Lead-time sources disagree; treat them as ranges and confirm with the manufacturer.
Wood Mackenzie via POWER Magazine (2026); Terrapin Consulting Group (2026, based on its own slot reservations).
Acceptance tests and a staged ramp protect the launch.
FAT proves the equipment at the builder; SAT proves it in the plant; ramp-up proves the people and process.
Factory acceptance test
At the builder, before shipping
- Run against written criteria: cycle time, quality, safety
- Buyer witnesses dry runs and sample parts
- Punch list closed before the crate is nailed shut
- Cheapest place to fix software and fit problems
Site acceptance test
In the plant, on real utilities
- Re-check after shipping, install and integration
- Verify safety systems, interlocks and e-stops
- Test with plant MES, network and material flow
- Sign-off triggers payment milestone and handover
Ramp-up and launch
From first part to rated rate
- Pilot builds, then rising rate by shift and line
- Operators and maintenance trained before volume
- Daily loss tracking: OEE, scrap, changeover
- Hyundai Georgia: first car Oct 2024, 500,000/yr design capacity
Virtual commissioning moves part of FAT and SAT into the model.
Standard commissioning practice; Georgia Dept. of Economic Development (Hyundai Metaplant America).
A digital twin is a live virtual copy used to test before acting.
It links a model to real data so teams can simulate changes in the virtual plant first.
What it is
A virtual model of a product, process or plant, fed by real-time data from the physical one.
What it is not
A static 3D drawing. Without live data and a feedback loop it is only a model.
Plan before building
BMW's Debrecen plant was the first it planned and validated entirely in a virtual factory.
Test robots at scale
NVIDIA Mega simulates multi-robot fleets in a facility twin before real deployment.
Cut planning cost
BMW expects its virtual factory to cut production planning costs by up to 30%.
Market is growing fast
One forecast puts digital twins at $21.1B in 2025 and $149.8B in 2030, 47.9% a year.
The value is fewer physical mistakes, not prettier pictures.
BMW Group (2023, 2025); NVIDIA (Mar 2025); MarketsandMarkets forecast.
A digital twin stacks data, models, simulation, apps and people.
Large vendors cover several layers; interoperability across them is the practical challenge.
Applications Use
Planning, commissioning, fleet and energy dashboards
Who plays where
- Siemens Xcelerator: Tecnomatix, Digital Twin Composer (mid-2026)
- NVIDIA Omniverse and Mega: simulation and robot fleet testing
- Dassault 3DEXPERIENCE and DELMIA: virtual twin and process planning
- Microsoft and Rockwell: cloud and control-level twins
- Accenture and integrators: build and tie the pieces together
Simulation and AI Predict
Physics, discrete-event, robot and synthetic data
3D and engineering models Model
CAD, plant scans, process and control logic
Data integration Connect
MES, PLC, sensor and ERP data; OpenUSD scenes
Edge and cloud compute Run
Plant edge servers, GPUs and cloud platforms
No single vendor owns the whole stack; plan for mixed tools.
Siemens and NVIDIA (CES, Jan 2026); NVIDIA (Mar 2025); Accenture and Schaeffler (Apr 2025); Dassault.
Digital twins pay off in planning, startup and operations.
Reported results are vendor or customer claims; the direction is consistent, the size varies.
| Use case | What the twin does | Reported example |
|---|---|---|
| Factory planning | Tests layouts and flow before building | BMW: digital twins of 30+ sites; up to 30% lower planning cost |
| Virtual commissioning | Tests PLC and robot code on a model | Wipro PARI: 70% less on-site commissioning time |
| Collision and flow checks | Runs assembly and logistics virtually | BMW: 3 days virtual vs ~4 weeks real test |
| Robot fleet testing | Simulates many robots in one facility | Schaeffler and Accenture test Agility Digit with Mega |
| Throughput optimization | Tests changes against live data | PepsiCo: 20% throughput gain on first deployment |
| Humanoid trials | Trains and tests robots in simulation | Hyundai (Atlas) and Mercedes (Apollo) in Mega |
Ask for the baseline behind any percentage before relying on it.
BMW Group (2025); Siemens (2026); Siemens/Wipro PARI; NVIDIA (Mar 2025); Siemens and NVIDIA (Jan 2026).
Start a twin with one costly problem, then climb the ladder.
Scope small, prove value, then connect more assets and decisions.
How to plan a twin
Five maturity levels
- Pick one decision with real cost: layout, downtime or commissioning
- Check data: sensors, PLC tags, MES, and who owns them
- Choose open formats (OpenUSD, OPC UA) to avoid lock-in
- Set a measurable target and a baseline before the build
- Name an owner on the plant side, not only in IT
- Budget for upkeep; a twin that drifts from the plant is useless
- 1 Descriptive: a 3D model and static data
- 2 Informative: live data shown on the model
- 3 Predictive: forecasts failures and bottlenecks
- 4 Prescriptive: recommends the best action
- 5 Autonomous: acts within set limits, humans supervise
Most plants today sit at levels one to three.
Common industry framing of digital twin maturity; Siemens and NVIDIA (2026).
Operations and workforce
How a running plant is organized, staffed, maintained and measured, and how robots change the work.
A plant runs on four linked loops: plan, source, make, deliver.
Each loop has an owner, a daily rhythm and a small set of numbers.
Plan
Match supply to demand
- Sales and operations plan monthly
- Master schedule and weekly production plan
- Capacity and labor check by line
- Owner: planning and scheduling
Source
Get materials in on time
- Purchasing, supplier quality and expediting
- Inventory targets by part class
- Inbound receiving and kitting
- Owner: supply chain and purchasing
Make
Convert inputs to product
- Production lines and cells by shift
- Maintenance keeps assets available
- Quality checks at station and final
- Owner: operations and production
Deliver
Ship and support
- Pack, label, load and ship
- Track on-time and in-full delivery
- Handle returns and warranty claims
- Owner: logistics and customer service
Daily management meetings tie the four loops together.
Standard supply-chain operating model (plan, source, make, deliver, return).
A plant is organized around a plant manager and five functions.
Typical mid-size discrete plant; titles vary by company.
- Plant manager
- Owns safety, cost, quality, delivery
Operations
Production managers
Engineering
Manufacturing engineers
Maintenance
Maintenance manager
Quality and EHS
Quality manager
Supply and support
Planner and scheduler
Shift supervisors
Industrial engineers
Mechanics and electricians
Inspectors and lab
Buyer and supplier quality
Line leads and operators
Automation and controls
Robot technicians
Safety manager
HR and training
Material handlers
Process engineers
Reliability engineer
Environmental lead
Finance controller
Maintenance, quality and safety each report with enough independence to stop a line.
Atomgigs synthesis of common plant structures.
Plants employ operators, technicians, engineers and managers.
Robots shift demand toward technicians who can program, maintain and troubleshoot.
Production operator
Runs machines, loads material, checks parts. Often paid hourly on a shift.
Assembler
Builds products by hand or with tools. 1.8M U.S. jobs in 2025, the largest group.
Machinist
Sets up and runs CNC and manual machines to tolerance. 288,300 jobs in 2025.
Welder
Joins metal by hand or monitors robotic weld cells. 437,700 jobs in 2025.
Maintenance technician
Repairs and services machinery. 547,300 jobs in 2025; 14% growth projected to 2035.
Robot / mechatronics tech
Installs, programs and maintains robots and controls; often under electro-mechanical titles.
Industrial engineer
Designs flow, labor and layout. 365,100 jobs in 2025; 12% growth projected.
Quality inspector
Measures parts and audits process. Uses gauges, CMMs and vision systems.
Machinist jobs are flat while maintenance jobs are projected to grow 14%.
BLS Occupational Outlook Handbook (May 2025 data; 2025 employment).
Manufacturers could leave 1.9 million jobs unfilled by 2033.
Retirements, skills gaps and weak entry pipelines meet new demand from reshoring and new plants.
3.8M
Jobs manufacturers may need by 2033
1.9M
Could go unfilled by 2033
12.7M
Manufacturing jobs, Sep 2026
3.1%
Job openings rate, 2025 average
867,700
Production openings per year
What the research says
Why it matters for automation
- Deloitte and Manufacturing Institute (Apr 2024) link the gap to growth and retirements
- Demand for simulation skills rose 75% over five years
- Retention levers: flexible schedules, pay, childcare, internal training
- Most firms partner with community colleges and schools
- Open shifts raise the cost of staying manual
- Robots shift hiring toward maintenance and programming
- Plants need people who can supervise machines, not only run them
Automation fills tasks; people are still needed to run it.
Deloitte and The Manufacturing Institute (Apr 2024); BLS CES (Sep 2026), JOLTS (2025), OOH (2026).
Pay rises with technical skill: from $45,450 to over $100,000.
U.S. median annual pay by occupation, May 2025.
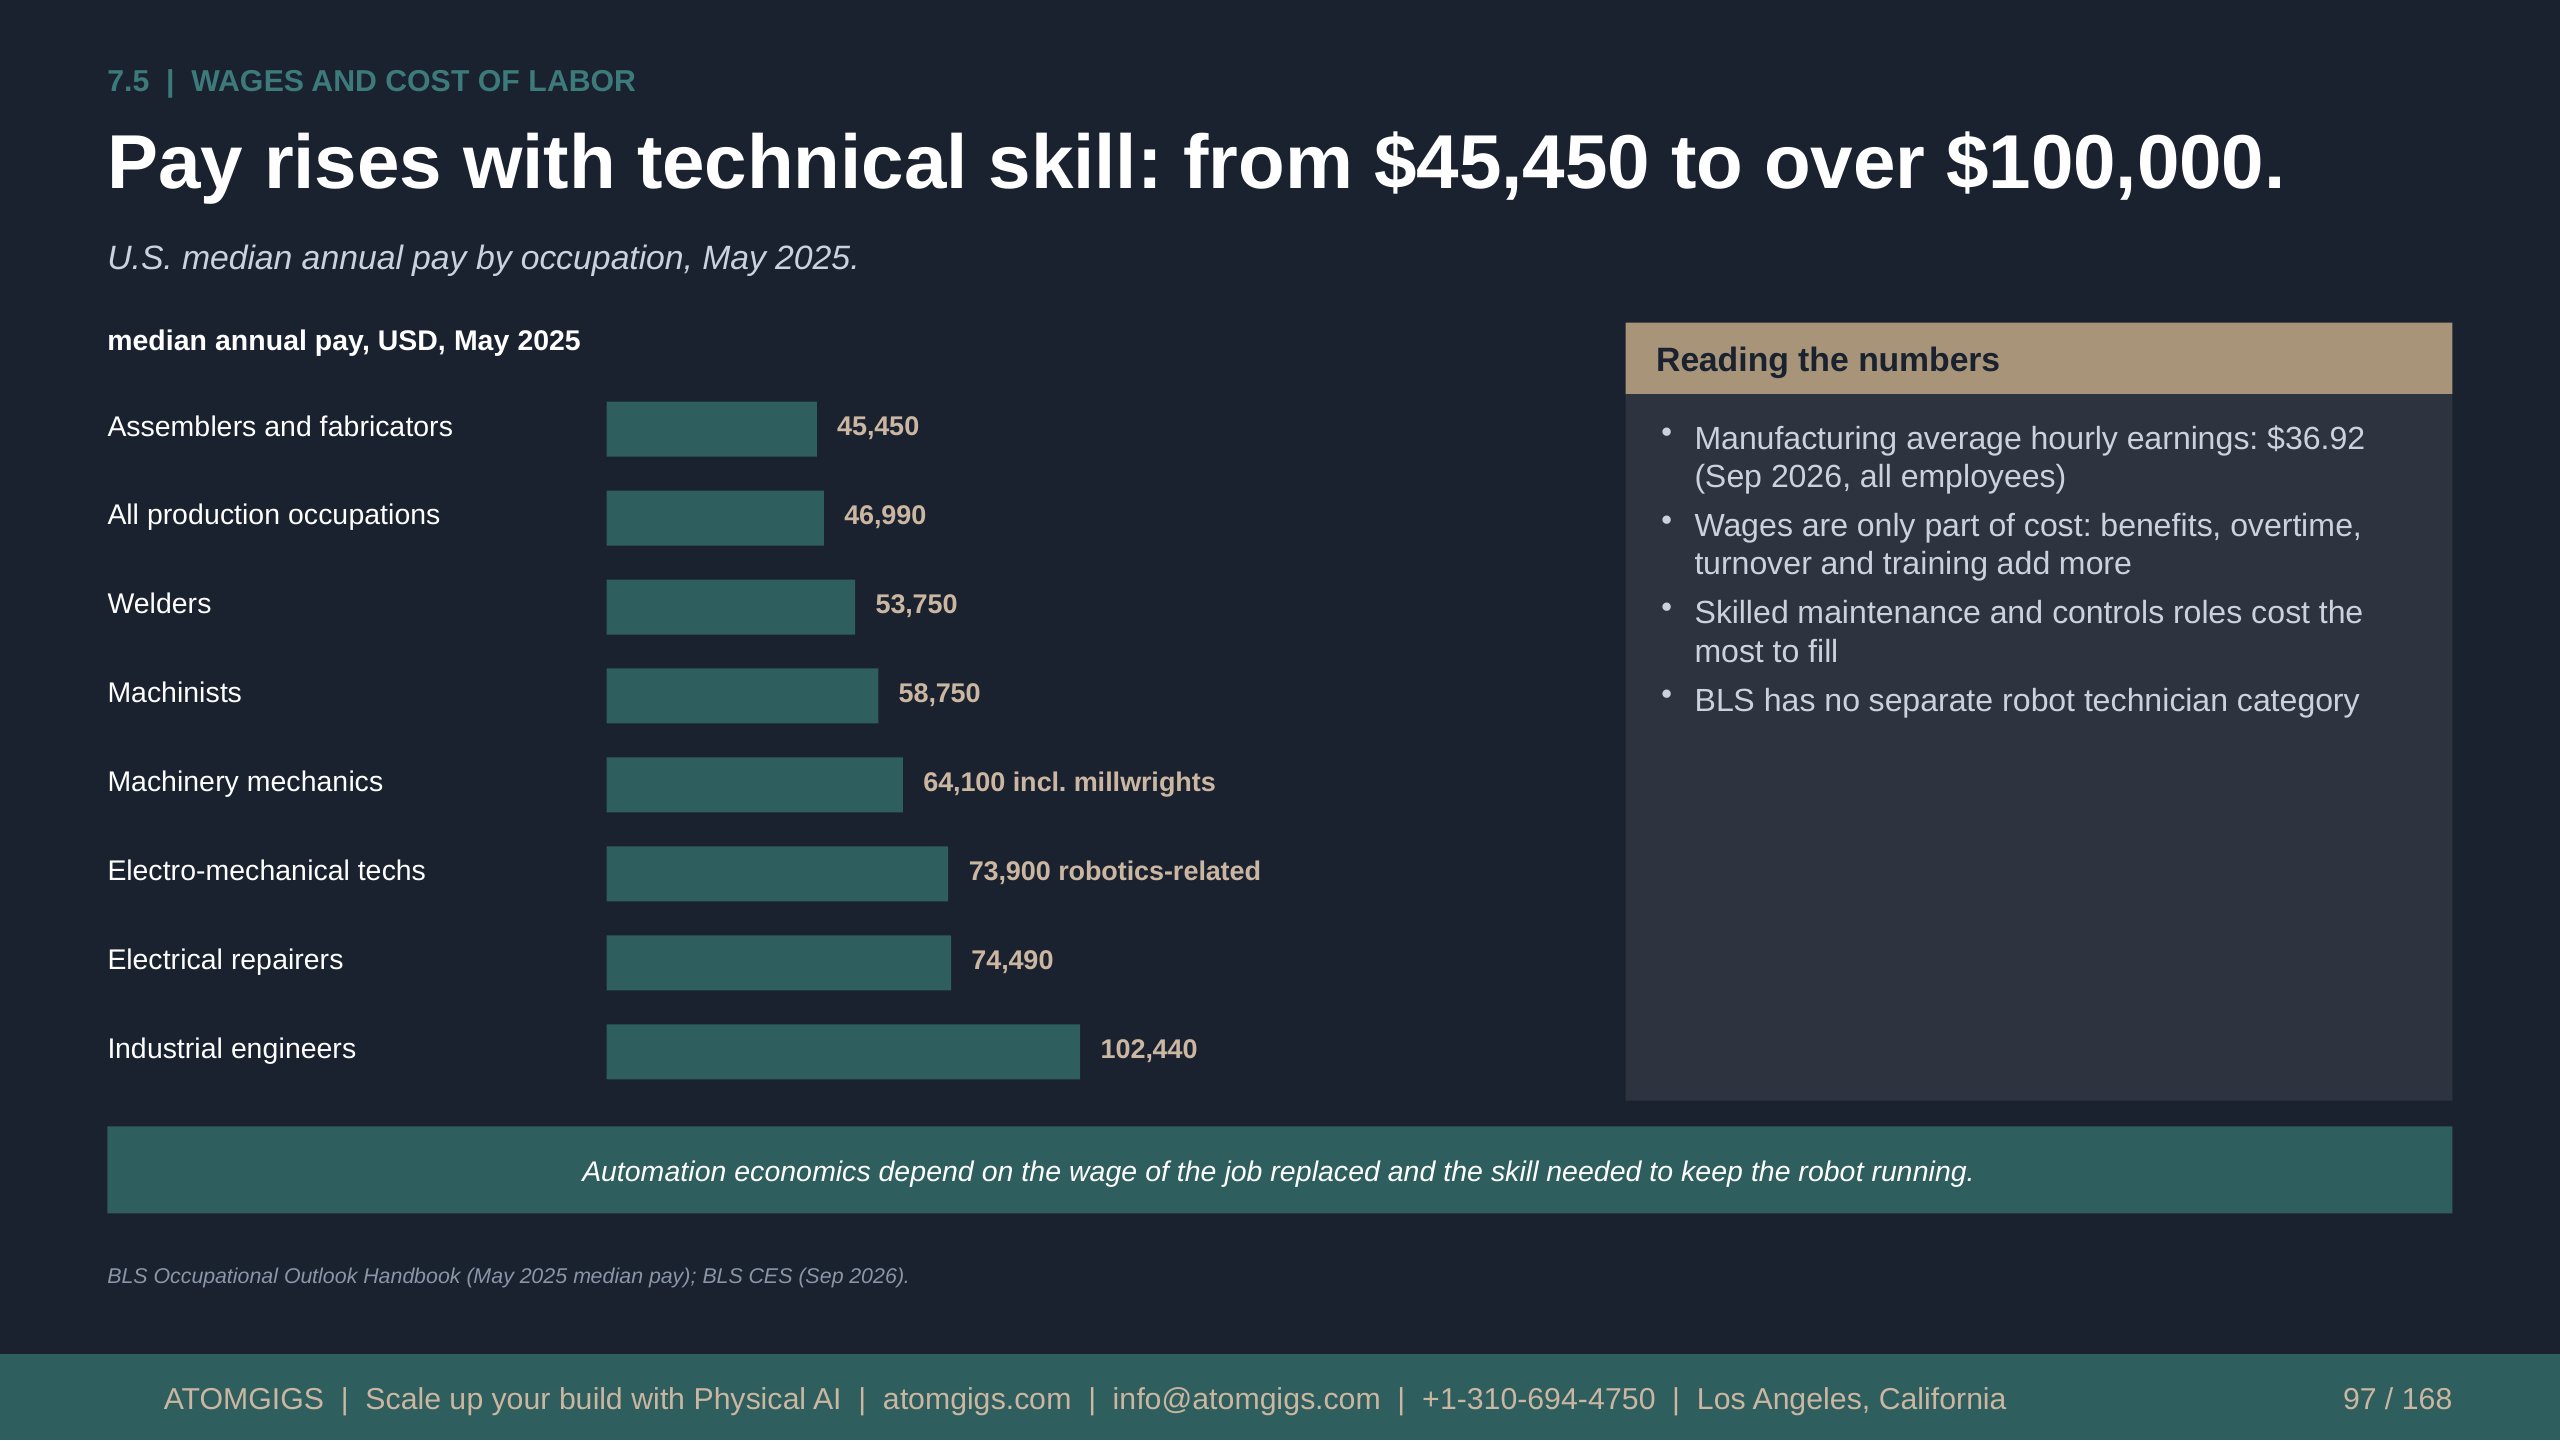
Text version
median annual pay, USD, May 2025
Reading the numbers
Assemblers and fabricators
45,450
- Manufacturing average hourly earnings: $36.92 (Sep 2026, all employees)
- Wages are only part of cost: benefits, overtime, turnover and training add more
- Skilled maintenance and controls roles cost the most to fill
- BLS has no separate robot technician category
All production occupations
46,990
Welders
53,750
Machinists
58,750
Machinery mechanics
64,100 incl. millwrights
Electro-mechanical techs
73,900 robotics-related
Electrical repairers
74,490
Industrial engineers
102,440
Automation economics depend on the wage of the job replaced and the skill needed to keep the robot running.
BLS Occupational Outlook Handbook (May 2025 median pay); BLS CES (Sep 2026).
Downtime is costly, so maintenance is moving to prediction.
Plants progress from fixing failures to scheduling work from machine condition data.
Reactive
Run to failure, then repair. Highest disruption and cost.
Preventive
Service on a calendar or run-hour schedule.
Condition-based
Act when sensors show wear or drift.
Predictive
Models forecast failure and time of repair.
Prescriptive
System recommends the action and parts.
$2.3M
Per hour, large auto plant
Unplanned stops per month, avg large plant
11%
Of revenue lost, Global 500
8-12%
DOE: saving vs preventive
Vendor claims run higher (Senseye clients: 50% less unplanned downtime); DOE figures are conservative.
Siemens True Cost of Downtime (2024); DOE O&M Best Practices Guide via Reliable Plant (2026).
Poor quality can cost 15 to 20 percent of sales.
Defect rates are measured in parts per million; each added sigma level cuts them sharply.
| Sigma level | Defects per million | Yield | What it means |
|---|---|---|---|
| 2 sigma | 308,538 | 69.1% | Very poor; heavy rework |
| 3 sigma | 66,807 | 93.3% | Typical of uncontrolled processes |
| 4 sigma | 6,210 | 99.38% | Good; common in industry |
| 5 sigma | 233 | 99.977% | High-quality assembly |
| 6 sigma | 3.4 | 99.99966% | World-class target |
U.S. manufacturers paid $30.4B in warranty claims in 2025, 1.30% of sales.
Six Sigma convention with 1.5-sigma shift; ASQ cost-of-quality rule of thumb; Warranty Week (2026): $30.37B U.S. claims in 2025.
Manufacturing injury rates fall but top the private average.
Robots remove some hazards and add others; guarding and training stay essential.
2.7
Recordable cases per 100 workers, 2024
2.3
All private industry, 2024
332,600
Manufacturing cases, 2024
5,070
U.S. work fatalities, all industries, 2024
Common hazards
How plants reduce risk
- Struck-by and caught-in: machines, forklifts, conveyors
- Overexertion and repetitive strain from manual handling
- Lockout/tagout failures during service
- Noise, dust, fumes and hot surfaces
- Machine guarding, light curtains and safety PLCs
- Lockout/tagout and permit-to-work systems
- Robot cells designed to ISO 10218 and ANSI/A3 R15.06
- Ergonomic automation for heavy or repetitive tasks
Safe automation removes people from the hazard, not the oversight.
BLS Survey of Occupational Injuries and Illnesses (2024); BLS Census of Fatal Occupational Injuries (2024).
Lean removes waste; Six Sigma removes variation.
Both grew from the Toyota Production System and the quality movement.
Toyota Production System
Source of lean: make only what is needed, when needed, with built-in quality.
Value stream mapping
Draw the flow of material and information to see waste between steps.
5S
Sort, set in order, shine, standardize, sustain. Workplace order as a base for everything else.
Kaizen
Small, continuous improvements led by the people who do the work.
Kanban and pull
Signals trigger production, so inventory follows real demand.
Cut changeover times so small batches become economic.
Jidoka
Machines stop on defects; the line never passes bad parts on.
Six Sigma DMAIC
Define, measure, analyze, improve, control: a data-led method to cut defects.
Automate a stable, lean process; automating waste only makes waste faster.
Toyota Production System and Six Sigma standard references.
Inventory buffers risk but ties up cash.
U.S. manufacturers hold about 1.5 months of shipments in inventory.
Where inventory sits
Levers to manage it
- Raw materials and purchased parts
- Work in process between steps
- Finished goods before shipment
- Spares and tooling for maintenance
- Safety stock sized to supplier variability
- Kanban and pull to cut work in process
- Dual sourcing for single-point suppliers
- Shorter changeovers allow smaller batches
- Digital twins and planning tools to test supply scenarios
Inventory-to-shipments ratio for U.S. manufacturing: 1.48 months, Aug 2026.
U.S. Census Bureau, M3 survey via FRED (Aug 2026): inventories-to-shipments ratio 1.48.
A few numbers run the plant every shift.
Compare each with your own baseline on a consistent definition.
| KPI | What it measures | Reference point |
|---|---|---|
| OEE | Availability x performance x quality | 85% world-class target; 55-65% in published studies |
| First-pass yield | Good parts first time, no rework | Track vs own baseline by line |
| On-time in-full | Orders shipped complete and on time | Track vs customer commitment |
| Unplanned downtime | Hours lost to unplanned stops | Large plant avg 27 hours a month (Siemens, 2024) |
| Recordable injury rate | Cases per 100 full-time workers | 2.7 in manufacturing, 2024 (BLS) |
| Inventory turns / ratio | Stock relative to shipments | 1.48 months of shipments, Aug 2026 |
| Energy per unit | kWh or MMBtu per unit of output | Track vs own baseline and peers |
Published OEE averages are not comparable unless plants define loss the same way.
Nakajima, Introduction to TPM; Chalmers studies (1998, 2016); Siemens (2024); BLS (2024); Census (2026).
Industry uses a third of U.S. energy; six sectors use most of it.
Efficiency, electrification and reuse cut cost and emissions together.
33%
Industry share of U.S. energy, 2025
30%
Share of energy CO2, 2020
97%
Of manufacturing energy: six sectors
17.8
Quadrillion Btu, six sectors (2022)
Energy-heavy sectors
The circular factory
- Chemicals, petroleum and coal products, paper
- Primary metals, food and nonmetallic minerals
- Discrete assembly plants use far less energy per dollar of output
- Metering by machine and line, then target the waste
- Compressed air leaks and idle machines are common savings
- Recover waste heat; electrify low-temperature heat
- Design for reuse; recycle scrap and remanufacture parts
Energy per unit is a plant KPI; track it with the same discipline as scrap.
EIA (2025, MECS 2022); U.S. DOE (2020).
Robot-era plants need technicians, certification and apprentices.
Training moves from running a machine to supervising a system of machines.
Robot operator and tech
Hands-on robot skills
- Vendor courses, e.g. FANUC ATC: 4-day operations course
- FANUC issues a training-completion certificate, not an exam
- Typical title: electro-mechanical tech, median $73,900
- Skills: programming, vision, grippers, troubleshooting
Maintenance
Keep systems running
- Industrial machinery maintenance jobs: 547,300 (2025)
- BLS projects 14% growth to 2035
- Needs mechanical, electrical, PLC and sensor skills
- Median $64,100 (May 2025)
Integrator and safety
Design and certify cells
- A3 Certified Robot Integrator program since 2012
- Certification valid two years; includes on-site audit
- Safety training on ISO 10218 and ANSI/A3 R15.06
- For integrators, not plant operators
Apprenticeships
Earn while learning
- 97,500 advanced-manufacturing apprentices, FY2025
- Up 20% over five years
- PMMI mechatronics standards used in DOL guidelines
- Fit for maintenance, machining, controls
Plants that train their own technicians cut dependence on a scarce outside labor market.
BLS OOH (May 2025); FANUC training catalog; A3; U.S. DOL Apprenticeship (FY2025); Deloitte (2024).
Financials
What manufacturers earn, what plants and cells cost, and how automation pays back.
Margins run from 2% in autos to 35% in chips.
Pre-tax operating margin by sector, U.S. firms, January 2026; gross margin shown beside each bar.
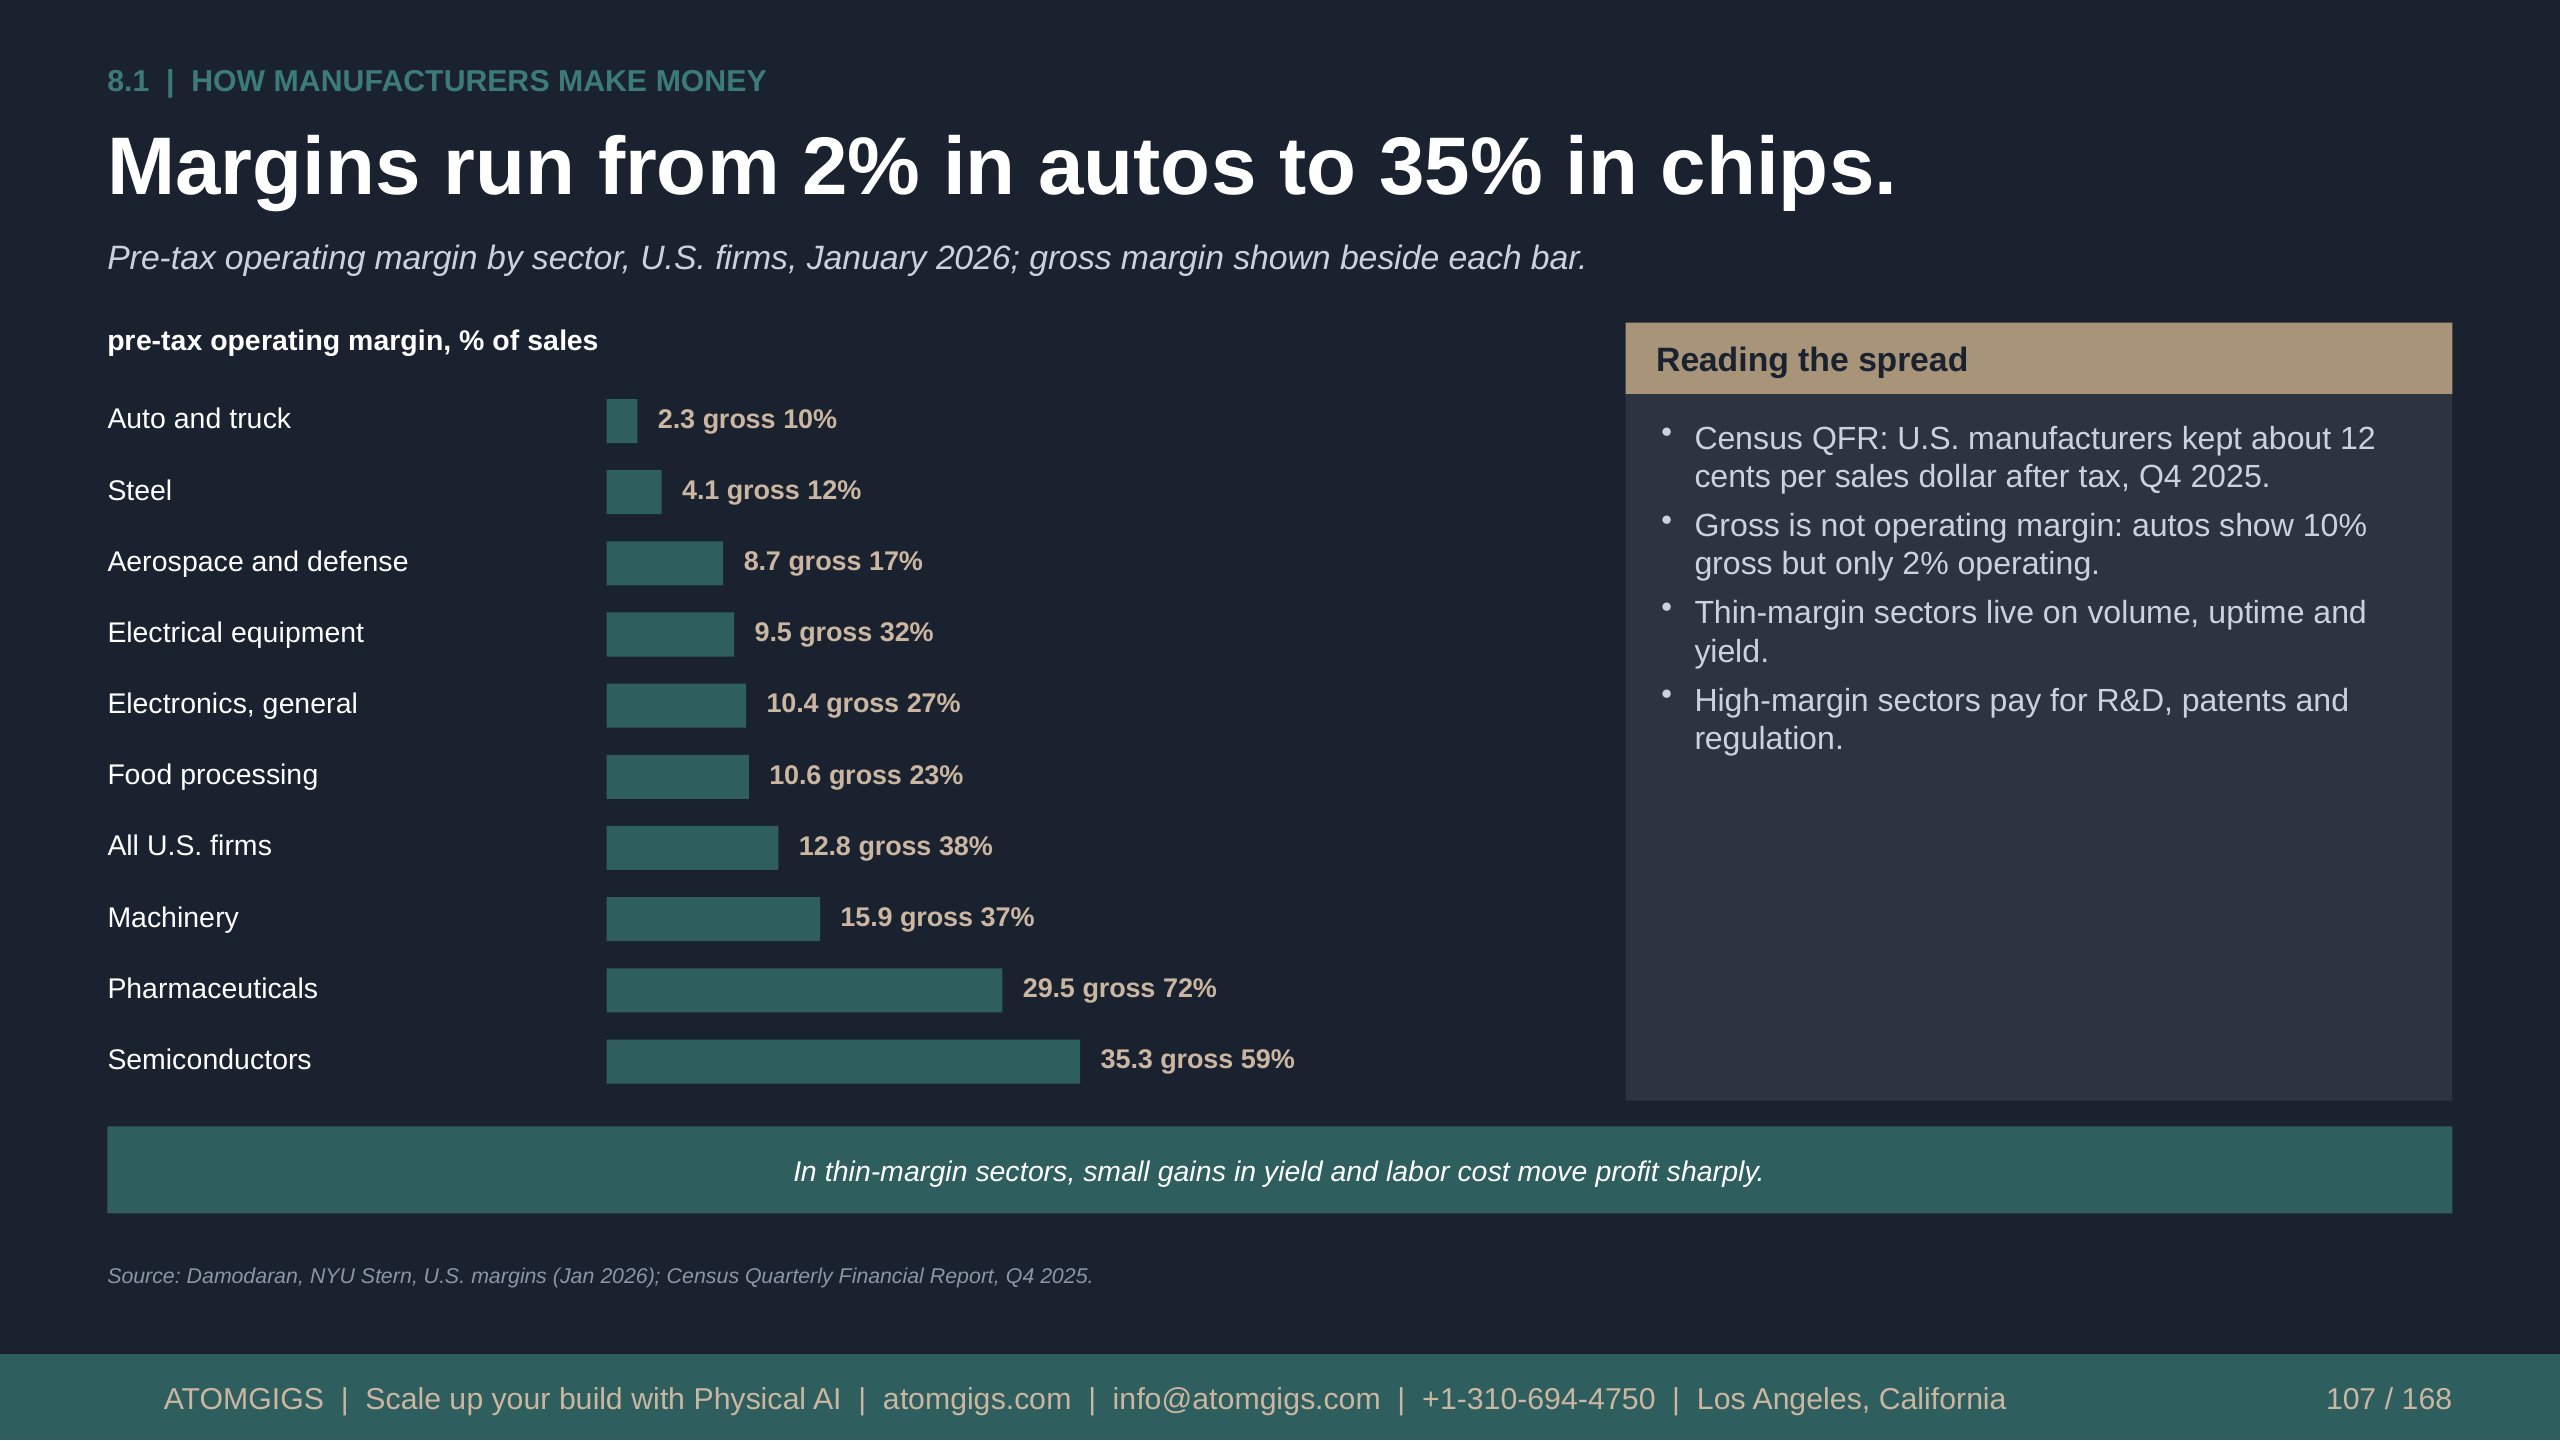
Text version
pre-tax operating margin, % of sales
Reading the spread
Auto and truck
2.3 gross 10%
- Census QFR: U.S. manufacturers kept about 12 cents per sales dollar after tax, Q4 2025.
- Gross is not operating margin: autos show 10% gross but only 2% operating.
- Thin-margin sectors live on volume, uptime and yield.
- High-margin sectors pay for R&D, patents and regulation.
Steel
4.1 gross 12%
Aerospace and defense
8.7 gross 17%
Electrical equipment
9.5 gross 32%
Electronics, general
10.4 gross 27%
Food processing
10.6 gross 23%
All U.S. firms
12.8 gross 38%
Machinery
15.9 gross 37%
Pharmaceuticals
29.5 gross 72%
Semiconductors
35.3 gross 59%
In thin-margin sectors, small gains in yield and labor cost move profit sharply.
Source: Damodaran, NYU Stern, U.S. margins (Jan 2026); Census Quarterly Financial Report, Q4 2025.
A product price is mostly materials, then payroll and overhead.
Illustrative split of $100 of product price; the payroll share is anchored on Census data, the rest is a composite.
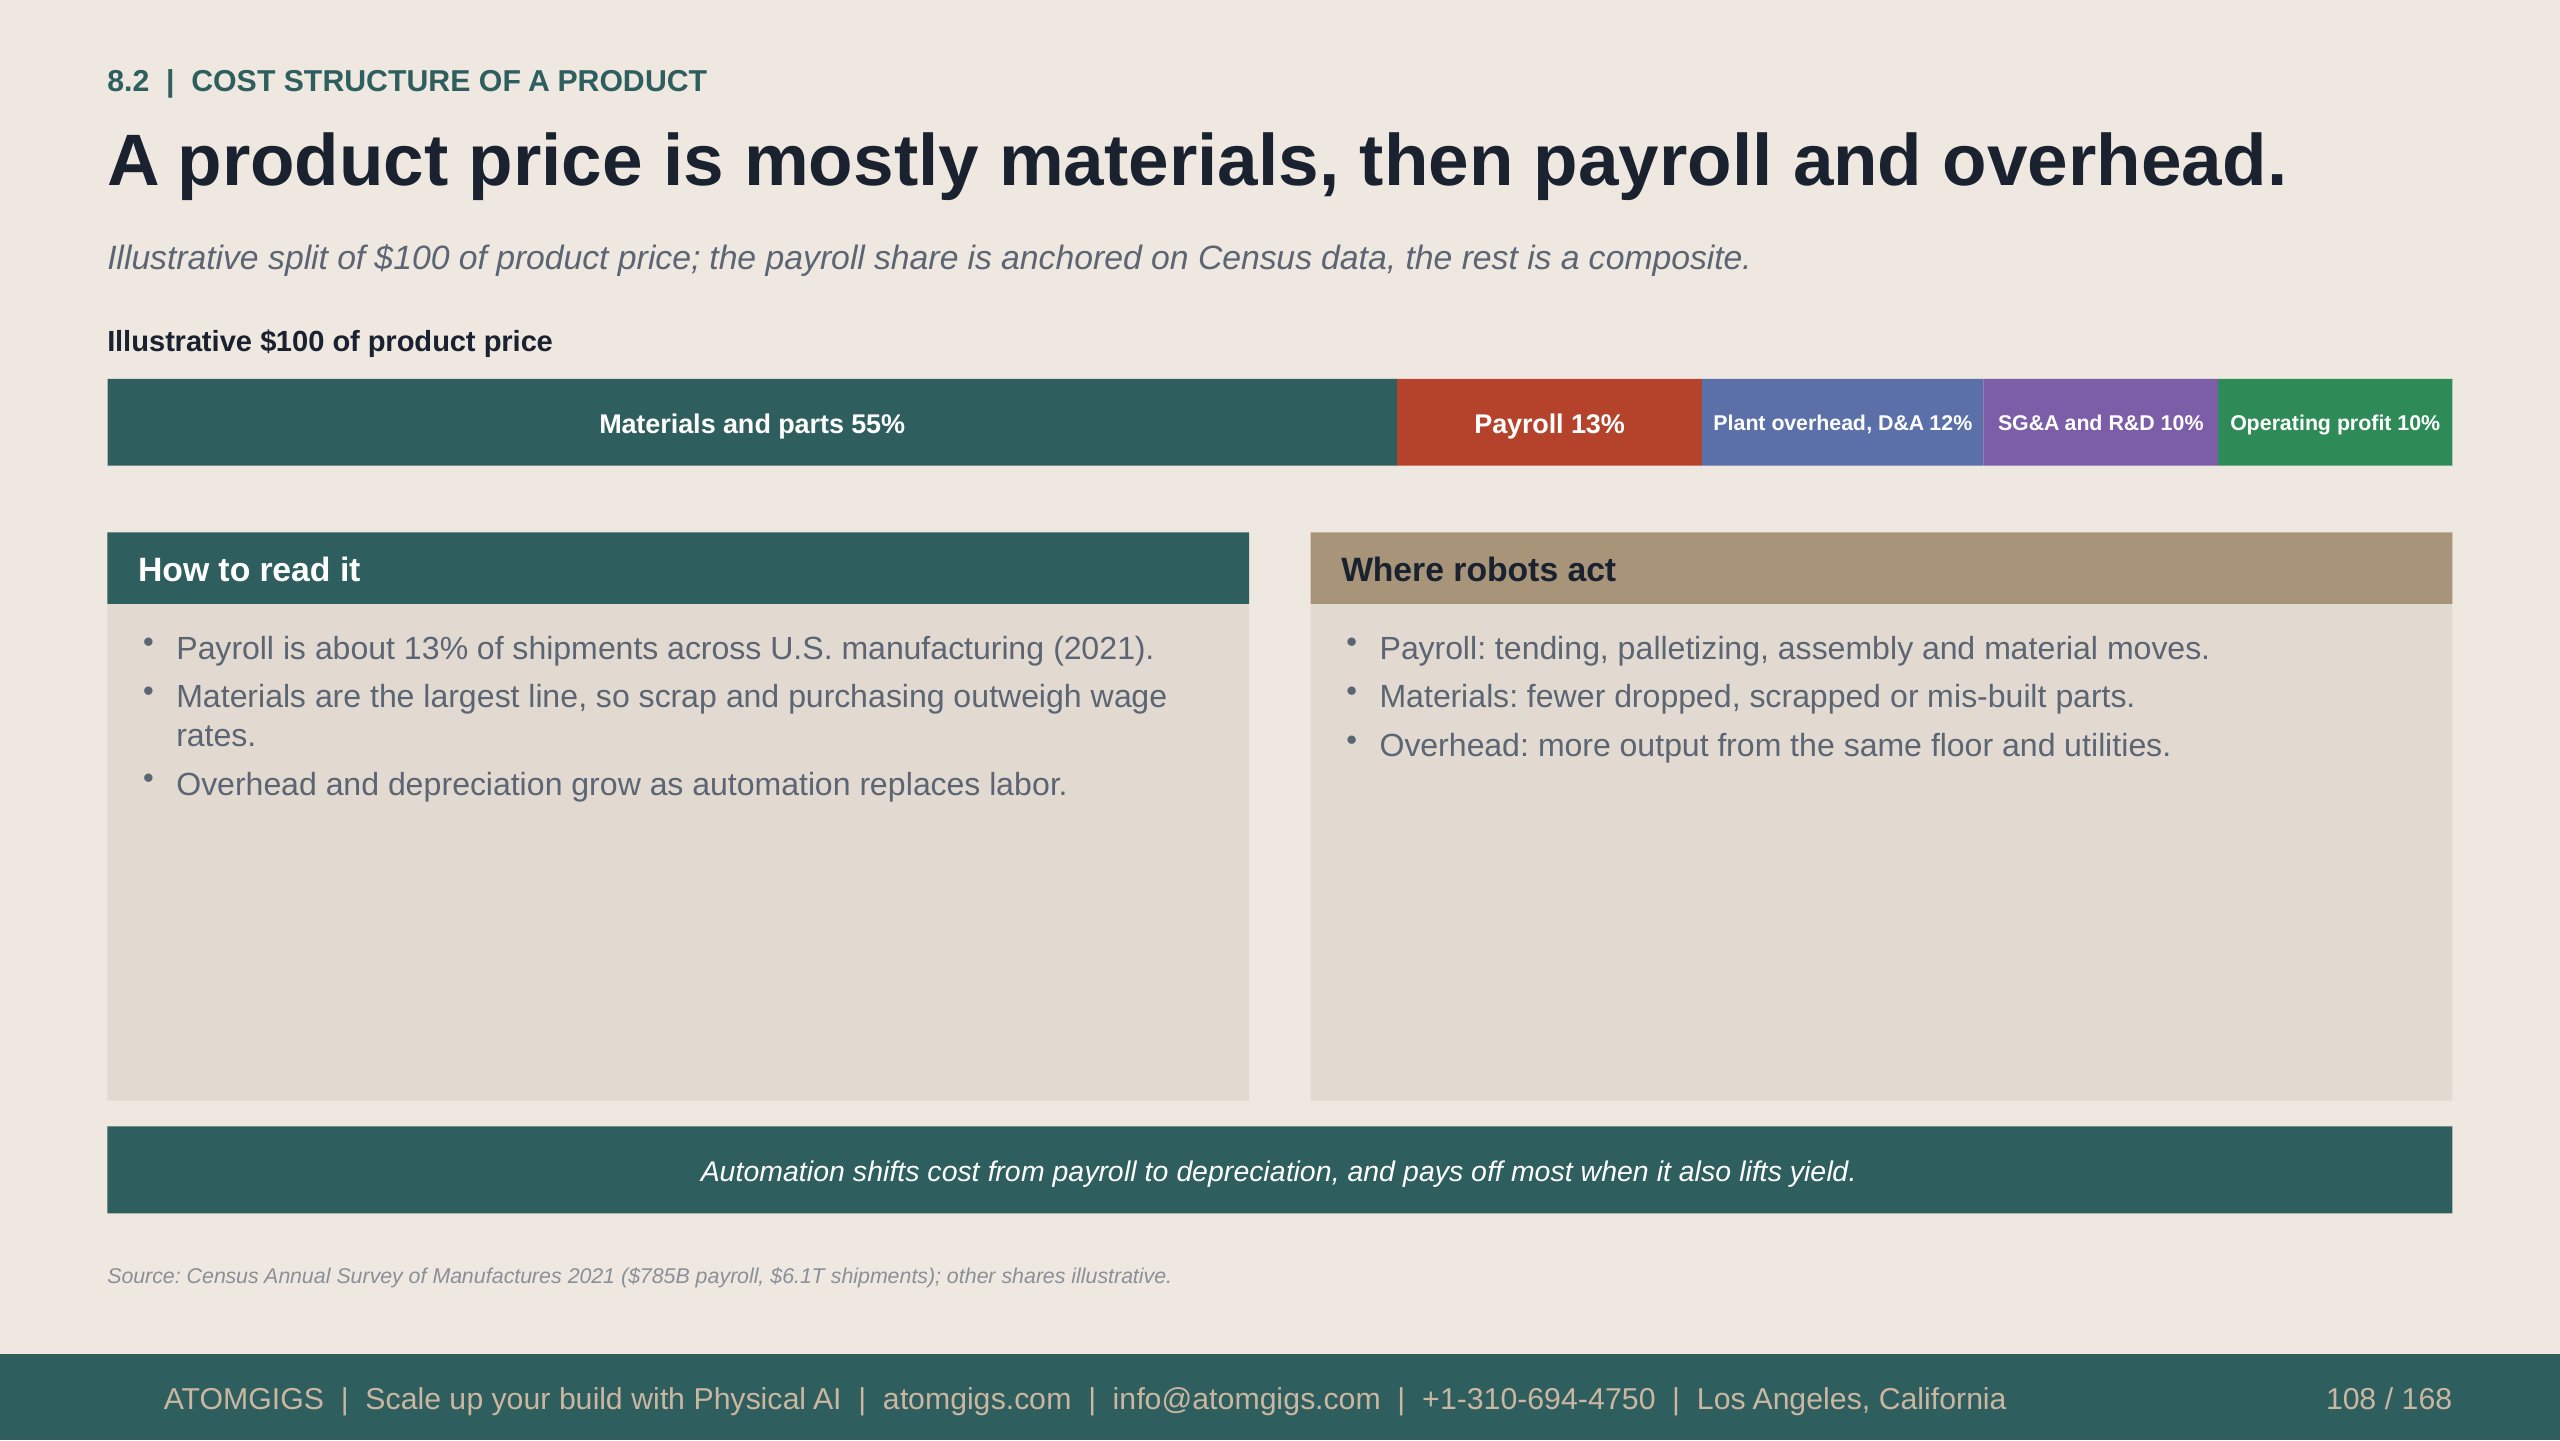
Text version
Illustrative $100 of product price
Materials and parts 55%
Payroll 13%
Plant overhead, D&A 12%
SG&A and R&D 10%
Operating profit 10%
How to read it
Where robots act
- Payroll is about 13% of shipments across U.S. manufacturing (2021).
- Materials are the largest line, so scrap and purchasing outweigh wage rates.
- Overhead and depreciation grow as automation replaces labor.
- Payroll: tending, palletizing, assembly and material moves.
- Materials: fewer dropped, scrapped or mis-built parts.
- Overhead: more output from the same floor and utilities.
Automation shifts cost from payroll to depreciation, and pays off most when it also lifts yield.
Source: Census Annual Survey of Manufactures 2021 ($785B payroll, $6.1T shipments); other shares illustrative.
Plant cost depends on process: shells are cheap, equipment is not.
Shell cost is a small part of a process plant; equipment, utilities and special rooms set the total.
$170B
U.S. manufacturing construction, Sep 2026
$78-$144
Per sq ft, new industrial shell, 2026
~$80M
Battery cell plant, per GWh a year
>2x
U.S. and Japan battery plant cost vs China
What drives cost
What it means
- Shell and core: $78 per sq ft for large buildings, $144 for small (distribution type).
- Process plants add equipment, utilities, cleanrooms and hazard controls on top.
- Battery plants: global average near $80M per GWh of annual capacity.
- U.S. and Japan sit well above China; Western costs have risen steadily.
- Fit-out and equipment, not the building, make most of a plant budget.
- New U.S. factory buildings may be expensed in full if built under 168(n) (8.9).
- Long-lead equipment sets the schedule (6.6).
Budget a plant by process and equipment first, then add the building.
Source: Census construction spending via FRED (Sep 2026); Cushman & Wakefield (Oct 2026); Thunder Said Energy.
The robot is about a third of what a cell costs.
One illustrative $150K cobot cell (the cell modeled in 8.8); the robot arm is $50K of it.
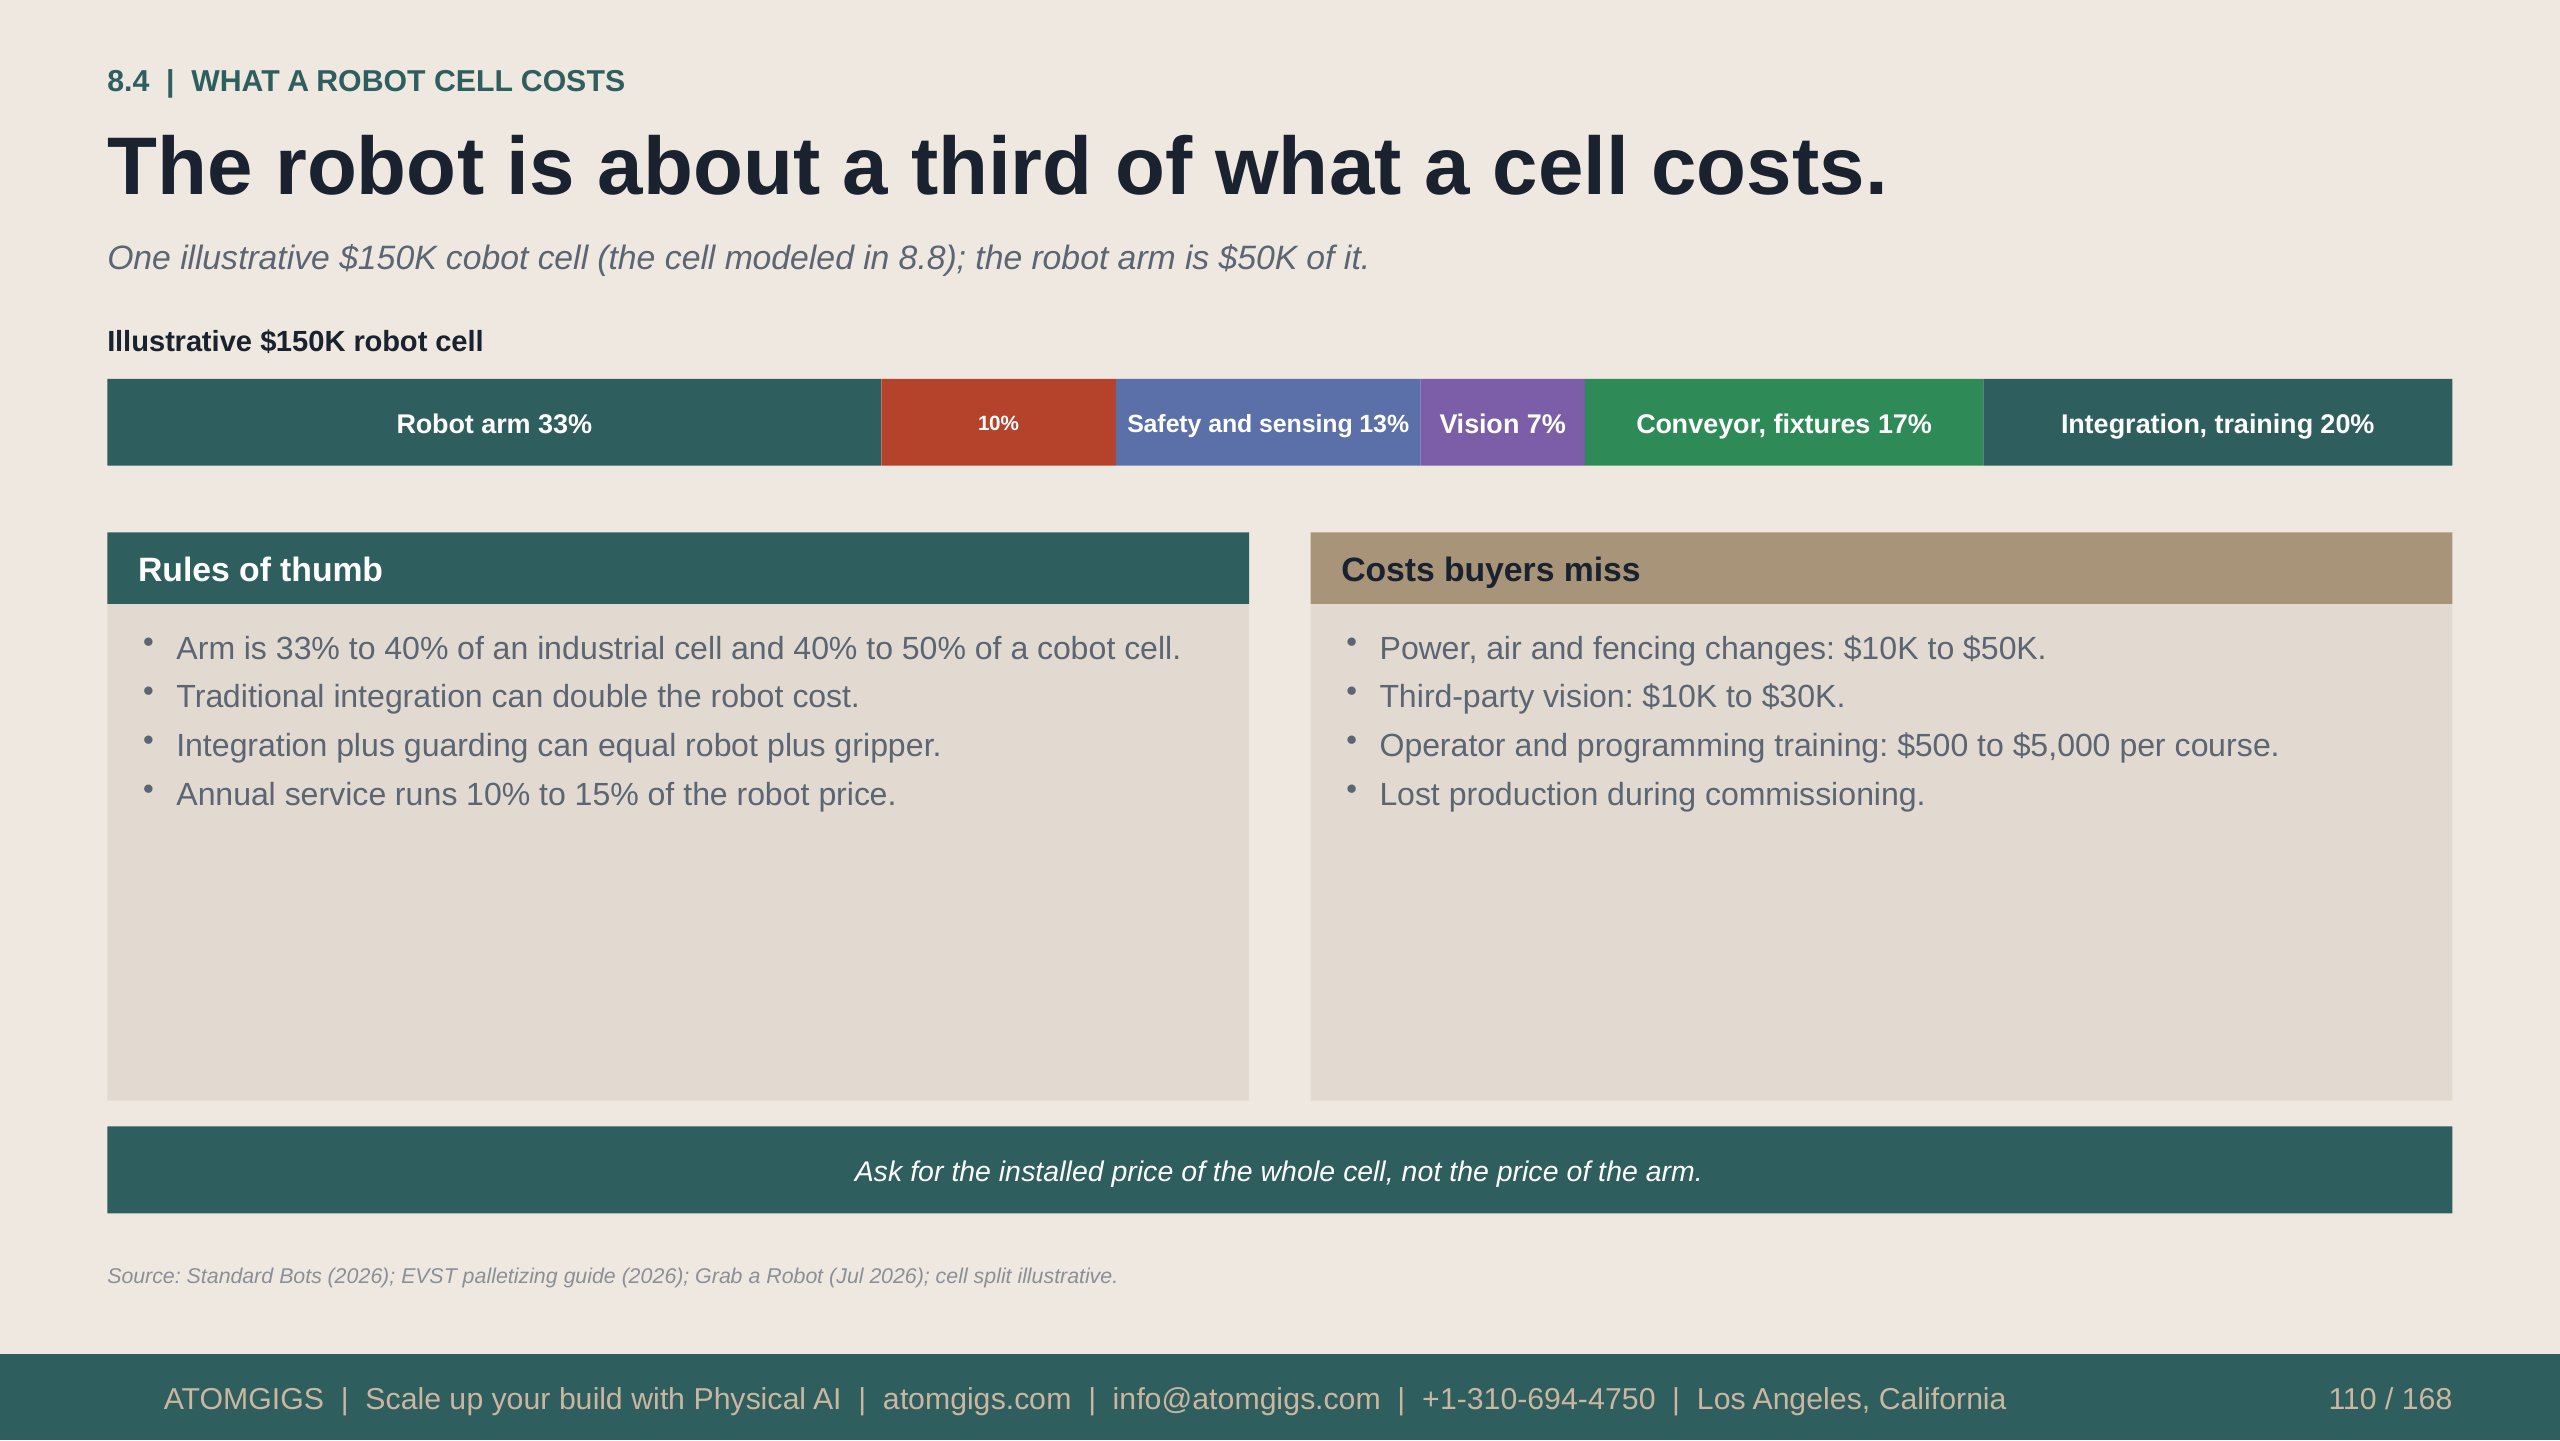
Text version
Illustrative $150K robot cell
Robot arm 33%
10%
Safety and sensing 13%
Conveyor, fixtures 17%
Integration, training 20%
Vision 7%
Rules of thumb
Costs buyers miss
- Arm is 33% to 40% of an industrial cell and 40% to 50% of a cobot cell.
- Traditional integration can double the robot cost.
- Integration plus guarding can equal robot plus gripper.
- Annual service runs 10% to 15% of the robot price.
- Power, air and fencing changes: $10K to $50K.
- Third-party vision: $10K to $30K.
- Operator and programming training: $500 to $5,000 per course.
- Lost production during commissioning.
Ask for the installed price of the whole cell, not the price of the arm.
Source: Standard Bots (2026); EVST palletizing guide (2026); Grab a Robot (Jul 2026); cell split illustrative.
Robot prices vary 10x by type, and the system costs more.
Typical 2025 to 2026 price ranges; vendor quotes vary with payload, reach, options and volume.
| Robot type | Robot price | Installed system | Notes |
|---|---|---|---|
| Articulated 6-axis arm | $50K-$200K | $150K-$500K | High payload and speed; usually fenced |
| Collaborative robot | $25K-$75K | $40K-$150K | Slower; fewer guards; easy to redeploy |
| AMR or AGV | $25K-$150K | $50K-$200K per robot | Fleet software adds $5K-$15K per robot |
| Humanoid, China-built | $5,900-$29,900 | Not published | Unitree R1 $5,900; G1 ~$13,800; H2 $29,900 list |
| Humanoid, full-size | $150K-$1M+ (est.) | Sold as service | Agility targets under 2-year ROI vs $30/h labor |
| All robots, N. America 2025 | ~$61K per unit | Not applicable | $2.25B across 36,766 units ordered (calc.) |
Humanoid prices span 100x because entry research units and industrial service models are different products.
Source: Standard Bots (2026); A3 (2026); Robotics Center (Oct 2026); Interesting Engineering (Jul 2025); Robot Report (2024).
Robots can be bought, leased or billed by the hour.
The choice shifts cash, risk and who keeps the cell running.
Buy
Lease or loan
Robots-as-a-service
| Upfront cash | Full system price | Down payment or none | None; provider finances |
|---|---|---|---|
| Pricing basis | Capex plus 10-15% a year service | Fixed monthly payment | Per hour or per outcome |
| Tax treatment | Eligible for 100% bonus depreciation | Varies by lease type | Fees are an operating cost |
| Service and uptime | Plant or integrator | Plant or integrator | Provider; uptime guaranteed |
| Obsolescence risk | Plant | Plant or lessor | Provider |
| Best fit | Stable, long-run tasks | Known task, low cash | Uncertain volume, few engineers |
Formic cites costs 42% below manual labor; that is a company claim, and hourly rates are not published.
Source: Robotics 24/7 and Gear Technology on Formic; Standard Bots (2026); Foster Swift OBBBA summary.
Robot cells typically pay back in one to three years.
Payback depends on shifts, labor rate and the full cell cost, not the robot price.
12-24 mo
Payback, multi-shift cell (industry view)
24-36 mo
Payback, single-shift cell
195 days
Vendor claim, UR cobots (2023)
<2 years
Agility target for Digit vs $30/h human
What drives payback
Read with care
- Shifts per day: two shifts roughly doubles the labor offset of one.
- Labor rate: manufacturing paid $36.92 per hour on average in Sep 2026.
- Total cell cost: integration, safety and tooling, not only the robot.
- Avoided scrap, damage and injury add to labor savings.
- Vendor payback figures are self-reported; method and sample are not published.
- Simple payback ignores financing, taxes, downtime and ramp-up.
- North American robot orders rose 6.6% to 36,766 units in 2025.
Test any payback claim against your own shifts, labor rate and installed cost.
Source: EVST (2026); Qviro on Universal Robots (2023); Robot Report (Jul 2024); BLS via FRED (Sep 2026); A3 (2026).
One automated cell can repay its cost in about 11 to 25 months.
Illustrative round numbers, not a forecast: one owned cobot palletizing or tending cell, before tax and financing.
Assumptions (illustrative)
Results (checked arithmetic)
- Installed cost $150K: arm $50K, plus tooling, safety, vision, fixtures, integration.
- Two shifts, 250 days: 4,000 operating hours; 90% uptime gives 3,600 robot hours.
- Replaces one operator per shift at $45 per hour fully loaded.
- The $45 is the BLS wage of $36.92 plus about 22% for benefits and taxes.
- Avoided scrap and damage: $18K a year.
- Running cost $18K a year: service $6K, spares $3K, technician time $9K.
- Five-year life; no resale value.
- Labor avoided: 3,600 h x $45 = $162K; plus $18K quality = $180K gross a year.
- Net: $180K - $18K = $162K a year. Payback $150K / $162K = 0.93 years, 11 months.
- Partial case: 60% of hours replaced, net $108K, payback 17 months.
- One-shift case: 1,800 h, quality $9K, net $72K, payback 25 months.
- Owned cost per hour: ($30K + $18K) / 4,000 h = $12, against $45 for labor.
- Year-one federal saving from 100% bonus depreciation: up to 21% x $150K = $31.5K.
Shifts, labor rate and integration cost move payback more than the robot price does.
Source: Atomgigs illustrative model; BLS average hourly earnings (Sep 2026); Standard Bots (2026) for service cost.
Tax rules and loans can cut the net cost of automation.
Federal rules from the 2025 tax law, SBA lending and public programs; confirm eligibility for each project.
Tax expensing
Federal, 2025 tax law
- 100% bonus depreciation made permanent after Jan 19, 2025.
- Section 179 limit $2.5M, phase-out from $4M, both indexed.
- Sec. 168(n): factory buildings expensed in full.
- Construction starts Jan 2025 to Dec 2028; in service by 2031.
- Offices and admin space are excluded.
Loans and leasing
SBA 504 and equipment finance
- SBA 504: 10, 20 or 25-year fixed rate.
- Typical 50/40/10 split of bank, CDC and borrower; 10% down.
- SBA portion up to $5.5M; equipment life 10+ years.
- Manufacturers pay 0% upfront and servicing fees (Oct 2025).
- Equipment loans and leases vary by lender.
Public programs
Federal advice and grants
- NIST MEP FY2024: $15B new and retained client sales.
- Same survey: $5B client investment, $2.6B cost savings.
- MEP centers help with assessments and automation planning.
- DOE Industrial Assessment Centers give free energy audits.
California and local
Check eligibility first
- California Competes credit rewards jobs and investment.
- State and city programs change often.
- Ask the state MEP center and GO-Biz what applies.
- Los Angeles area agencies can point to local grants.
Expensing and fixed-rate loans can pull the real cost of a cell well below its sticker price.
Source: Foster Swift OBBBA summary; UHY on IRS Notice 2026-16; SBA; RMCRE (2026); NIST MEP (Mar 2025).
Value comes from yield, labor, utilization and quality.
Six levers that move plant profit; robots touch most of them.
Throughput
More good units per hour from the same plant spreads fixed cost; OEE shows the gap.
Material yield
With materials the largest cost line, one point of scrap saved outweighs one point of wages.
Labor productivity
Robots take repetitive handling; people move to setup, quality and maintenance work.
Asset utilization
The cell in 8.8 nets $162K a year on two shifts against $72K on one.
Quality and warranty
Fewer defects cut rework, returns and recalls; vision makes the check consistent.
Working capital
Shorter lead times and reliable lines allow smaller buffers and free cash.
Automation pays most when it raises uptime and yield, not only when it cuts a wage line.
Atomgigs in manufacturing and outlook
Where an operated hybrid workforce fits in a plant, how pilots run, and what comes next.
Atomgigs supplies an operated hybrid crew, not just robots.
A Mavengigs Ventures company in Los Angeles. It does not build robots; it sources, integrates and operates them.
- Plant and project owners
- Plants, lines and cells
- Source robots
- Direct from robot makers
- Vetted skilled labor
- Crews that work with robots
- Hybrid crew on site
- Humans plus robots
- Robot makers and OEMs
- Advisory
- Design and integrate
- Tasks, tooling, IoT, twins
- Train and supervise
- A human manager per robot
- Weekly reporting
- On agreed metrics
- Investors
- Advisory
- Run the fleet
- Stays to operate
- Priced work
- Per crew, robot or unit
Humans in the lead, physical AI in the loop.
Atomgigs designs, staffs and runs the work, not just the robot.
Six capabilities that together make one operated service.
Match robot to task
Robot-agnostic: sources direct from makers and picks the type that fits the task.
Supply vetted labor
Skilled crews work beside the robots; each robot has a designated human manager.
Train and supervise
Trains crews and plant staff; a senior site pod supervises daily work and safety.
Design the task
Defines the scope, the handoffs between people and machines, and the success metric.
Coordinate equipment
Ties robots, automation, IoT and digital twins to the plant's own equipment.
Operate and report
Runs the fleet, stays to operate, and reports weekly on agreed metrics.
Robots fit first where work is repetitive, heavy and well defined.
Eight manufacturing tasks ranked by how readily they suit a first pilot.
| Use case | Typical robot | Plant area | Why it fits | Entry |
|---|---|---|---|---|
| Machine tending | Cobot or small arm | Machining, molding | Fixed cycle; covers shift gaps | Pilot |
| Palletizing, end-of-line | Cobot palletizer | Packing, shipping | Heavy, repetitive, ergonomic risk | Pilot |
| Material transport | AMR | Stores to cells | Wheeled; no handling needed | Pilot |
| Inspection and quality | Arm or fixed vision, AI | Final test, in-line | Consistent and data rich | Pilot |
| Kitting, line-side supply | AMR plus cobot | Assembly lines | Many small repeat moves | Pilot |
| Tote moving | Humanoid | Aisles, docks | Fits human-built spaces; early | Pilot |
| Welding and finishing | Arm cell | Fabrication | Needs fixtures and guarding | Later |
| Assembly, screwdriving | Cobot or SCARA | Assembly | Part variation raises effort | Later |
Start with a task that is boring, bounded and measurable.
Source: Part 5 application slides; Atomgigs pilot design.
Six pilot packages, each one scope in four to eight weeks.
Fee based on Atomgigs' own estimate, low commitment; the robot is chosen per task.
| Pilot | Scope | Typical robot | Success metric | Weeks |
|---|---|---|---|---|
| Machine tending cell | Load and unload one CNC or press, one part family | Cobot or arm on stand | Utilization and parts per shift vs baseline | 6 |
| Palletizing, end-of-line | One line, one to two pallet patterns | Cobot palletizer | Cases per hour; changeover time; no injuries | 4-6 |
| AMR material transport | One route between stores and two cells | AMR with cart or lift | On-time deliveries; manual moves removed | 6-8 |
| Inspection and quality | One station with a defined defect list | Arm or fixed vision, AI | Defect catch rate; false rejects | 6-8 |
| Kitting, line-side supply | One line with a defined kit list | AMR plus cobot | Line stops from shortages; kits per hour | 6-8 |
| Humanoid tote moving | One tote flow in a marked pilot zone | Humanoid | Totes per hour; interventions per shift | 8 |
Every pilot ends with a review against its metric and a decision to scale, change or stop.
A pilot runs in five steps from scope to a scale decision.
One defined scope, one site, one metric.
Scope
Design
Source and integrate
Run with a crew
Review and decide
Pick one task, site and metric; walk the floor and agree the baseline.
Choose robot type, layout, safety approach and the human roles.
Source from the maker; install, connect to plant systems, test.
The pod runs the cell on live work; a human manages each robot.
Weekly reports, then an end-of-pilot review: scale, change or stop.
4-8 wks
Pilot length
Defined scope
Low
Commitment
A small senior pod runs each site as one hybrid workforce.
A pod, not a pyramid; each robot has a designated human manager, and one person may oversee several.
- Site pod
- Humans in the lead
Pod Lead
Robotics Lead
Skilled Crew
Safety and Compliance
Remote Ops and Data
Owns the site plan
Selects and configures robots
Vetted trades and operators
Risk assessments
Remote fleet monitoring
Client contact
Integration and tuning
Work beside the robots
Standards adherence
Weekly reporting
Schedules crews
Fleet health
Hands-on tasks
Incident review
IoT and twin data
Humans in the lead, physical AI in the loop.
Adoption moves in four phases, never faster than safety permits.
A plant can stop at any phase; each step up needs its safety case and metrics met.
Phase 4: Robot-led Most autonomy
Robots do the core task; people handle exceptions.
Rules for moving up
- Safety case approved for the new phase.
- Metrics from the last phase met and reviewed.
- Plant leadership agrees the next scope.
- A human manager is named for every robot.
Phase 3: Hybrid crews Shared work
People and robots share one workflow with designed handoffs.
Phase 2: Robot-assisted First robots
Robots take single tasks with a human manager beside them.
Phase 1: Human crews Baseline
Skilled crews do the work; tasks are mapped and baselined.
Safety is designed in, using current robot and AMR standards.
Standards set the baseline; the site pod and the plant's safety team own the safety case.
Standards in scope
How Atomgigs applies them
- ISO 10218-1:2025: safety requirements for industrial robots (Edition 3, Feb 2025).
- ISO 10218-2: robot systems and their integration.
- ISO/TS 15066: collaborative operation and contact force limits.
- ANSI/A3 R15.06: the U.S. adoption of the ISO 10218 series.
- ISO 3691-4: driverless industrial trucks, which covers AMRs.
- Humanoid and legged robot standards are still emerging; pilots use marked zones.
- Site risk assessment before any robot moves, with a written safety case per cell.
- A Safety and Compliance role sits in every site pod.
- A designated human manager for each robot.
- Plant safety staff review guarding, stops and zones.
- Phases advance only when safety permits.
- Incidents and near misses reviewed weekly with the plant.
Source: ISO (ISO 10218-1:2025); Atomgigs operating model.
Every pilot reports against a baseline on five measures.
Data comes from plant systems, robot logs and crew records; results go to the client weekly.
- Plant systems
- MES, ERP, quality records
- Robot logs
- Cycles, faults, uptime
- OEE and uptime
- Availability, rate, quality
- Throughput
- Units and cycle time
- Weekly report
- To the client
- IoT sensors
- Counts, energy, vision
- Quality
- First-pass yield, defects
- Labor
- Hours per unit
- Pilot review
- Scale, change, stop
- Crew records
- Hours, interventions
- Safety
- Incidents and near misses
- Outcome price basis
- Per unit of finished work
- Safety records
- Incidents, near misses
The baseline is set before the robot starts, so the result can be checked.
Clients move from a pilot to managed crews to outcome pricing.
Each step is optional; commitment grows only as results are shown.
| Stage | What the client buys | Pricing | Commitment | Reporting |
|---|---|---|---|---|
| Pilot | One defined scope, 4 to 8 weeks | Fee from Atomgigs' own estimate | Low | Weekly |
| Managed Crew | An operated crew or robot | Monthly fee per crew or robot | Flex on notice | Weekly |
| Outcome-Based | Finished work delivered | Price per unit; shared savings | Tied to results | Weekly |
| Advisory | Guidance on robots and deals | For robot makers and investors | Per engagement | Per scope |
The client pays for the crew or the result, not for owning and running robots.
Atomgigs serves plant owners, robot makers and investors.
Three client types, each with a different starting point.
Plant and project owners
COOs, VPs of operations
- Start with a 4-to-8-week pilot on one task.
- Get crews and robots without hiring robot staff.
- Move to a managed crew when results are shown.
- PE operating partners can use pilots across a portfolio.
Robot makers and OEMs
Sourcing and advisory
- Atomgigs sources robots directly from the maker.
- Operated deployments give makers real plant use.
- Advisory on go-to-market and deployment.
- Robot-agnostic: the task picks the robot.
Investors
Advisory
- Advisory on automation and robotics opportunities.
- Advisory on where operated physical AI can scale.
- Founder has 30+ years in M&A, integration and PMO.
- Founder managed a manufacturing plant build-out.
Manufacturing is the newest sector Atomgigs is entering; data centers, construction, transit and oil and gas came first.
Falling prices, AI and tax rules are reshaping factory automation.
Demand is rising while entry costs fall, and new business models lower the barrier.
36,766
N. American robots ordered, 2025 (+6.6%)
$2.25B
N. American robot order value, 2025
23.7%
Cobot share of robot units, Q2 2025
$5,900
Lowest list price humanoid (Unitree R1)
Trends to watch
- Cobots and AMRs lower the entry cost for mid-size plants.
- Robots-as-a-service removes upfront cost.
- AI-enabled models price 20% to 40% higher but handle variation.
- Digital twins let cells be tested before install.
- Full expensing favors capital projects through the decade.
Lower entry cost widens the set of plants where a pilot makes sense.
Source: A3 (2025 and H1 2025 reports); Interesting Engineering (Jul 2025); Standard Bots (2026); Robotics 24/7.
The outlook is strong, but integration and safety set the pace.
Opportunities and constraints for operated automation in plants.
Outlook
Challenges
- Labor gaps and reshoring raise demand for flexible automation (Parts 2 and 7).
- Prices are falling: cobots from $25K, China-built humanoids from $5,900.
- Expensing rules lower the after-tax cost of cells.
- Managed and outcome-based models let plants start without owning robots.
- Safety standards were refreshed in 2025 (ISO 10218-1).
- Manufacturing is new for Atomgigs; each pilot must prove the model.
- Installed cells often cost two to three times the robot price.
- Integration capacity is limited and projects slip.
- Humanoids lack mature safety standards and public pricing.
- Low-volume work may not justify a cell.
- Tariffs and policy can change the cost of robots and parts.
Ten facts to remember about manufacturing economics and Atomgigs.
The numbers and the model, in one page.
Margins are thin in most areas
Pre-tax operating margins run from 2% in autos to 35% in chips (Damodaran, Jan 2026).
The robot is a third of a cell
Installed cost is often two to three times the robot price once tooling and integration are added.
Payback is one to three years
Industry views: 12-24 months for multi-shift cells, 24-36 months for single shift.
Tax rules help
100% bonus depreciation and a $2.5M Section 179 limit lower the after-tax cost.
Pilots take 4 to 8 weeks
One defined scope, a fee based on Atomgigs' own estimate and low commitment.
Materials lead the cost stack
Payroll is about 13% of shipments (Census 2021); materials are the largest share.
Prices vary by type
Cobots $25K-$75K, arms $50K-$200K, AMRs $25K-$150K; humanoids list from $5,900.
Pay-as-you-go exists
Robots-as-a-service removes upfront cost; hourly rates are rarely published.
Atomgigs runs hybrid crews
It sources robots from makers, supplies skilled labor and stays to operate.
Safety sets the pace
Four phases, never faster than safety permits; a human manages each robot.
Visual guide
What factories, machines and robots look like, from the plant floor to the robot cell.
Car final assembly line
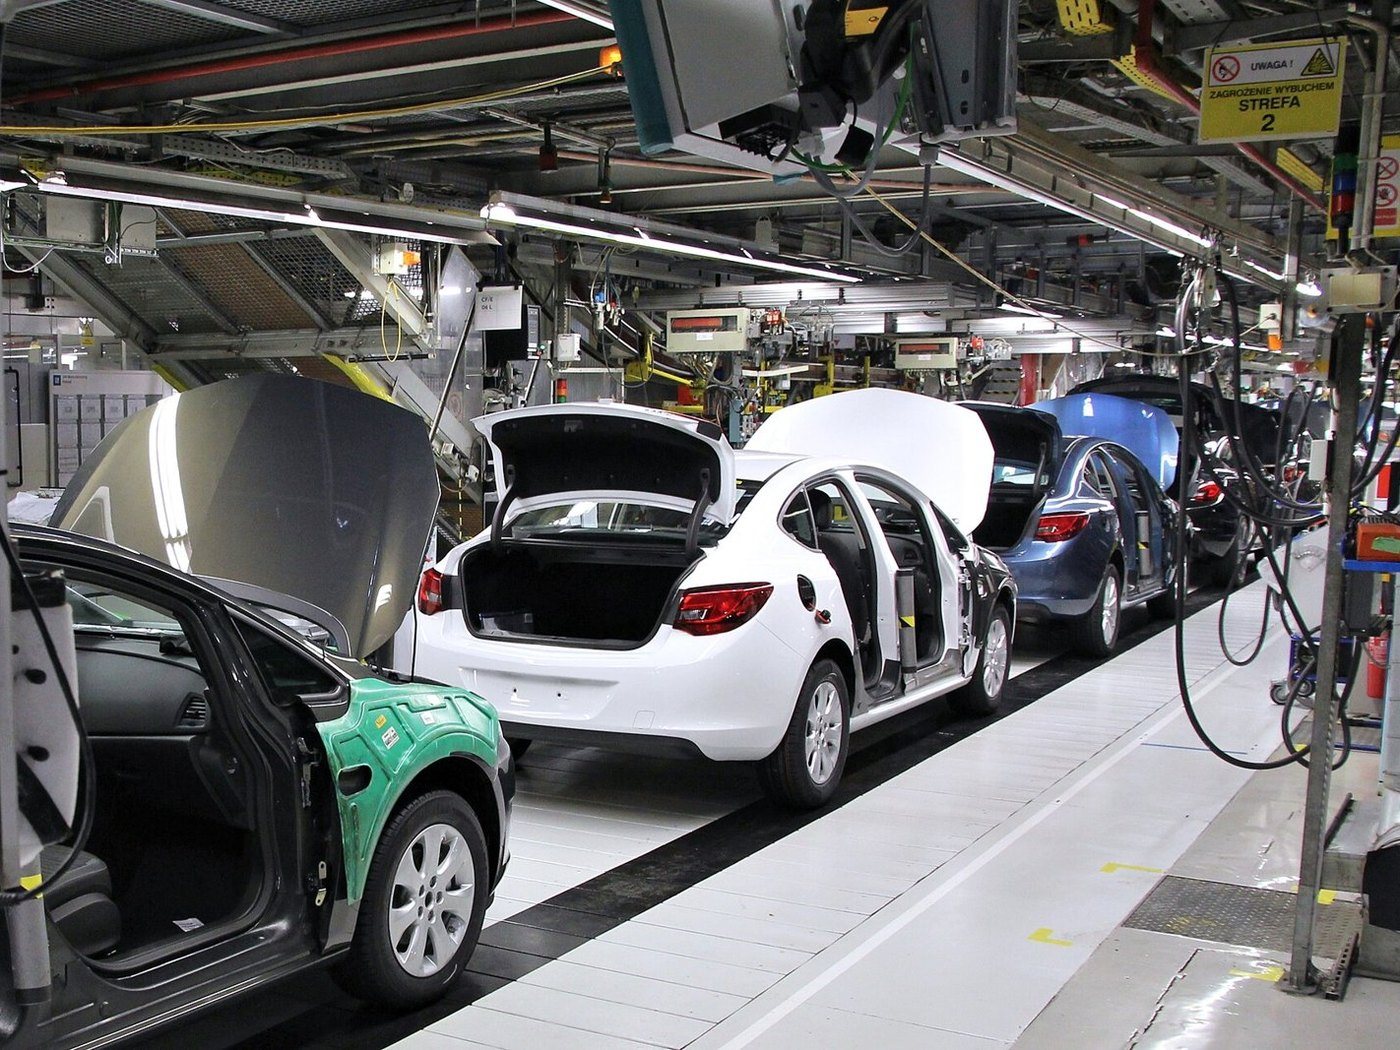
- What You Are Seeing
- Vehicles moving along a final assembly line.
- Assembly stations are paced by the conveyor, which sets plant throughput.
- In The Primer
- Part 3 · 3.3 Inside a discrete assembly plant
Where: GM Manufacturing Poland, Gliwice · Photo: Wikimedia Commons, Marek Ślusarczyk (Tupunga), CC BY 3.0
Beverage bottle filling line
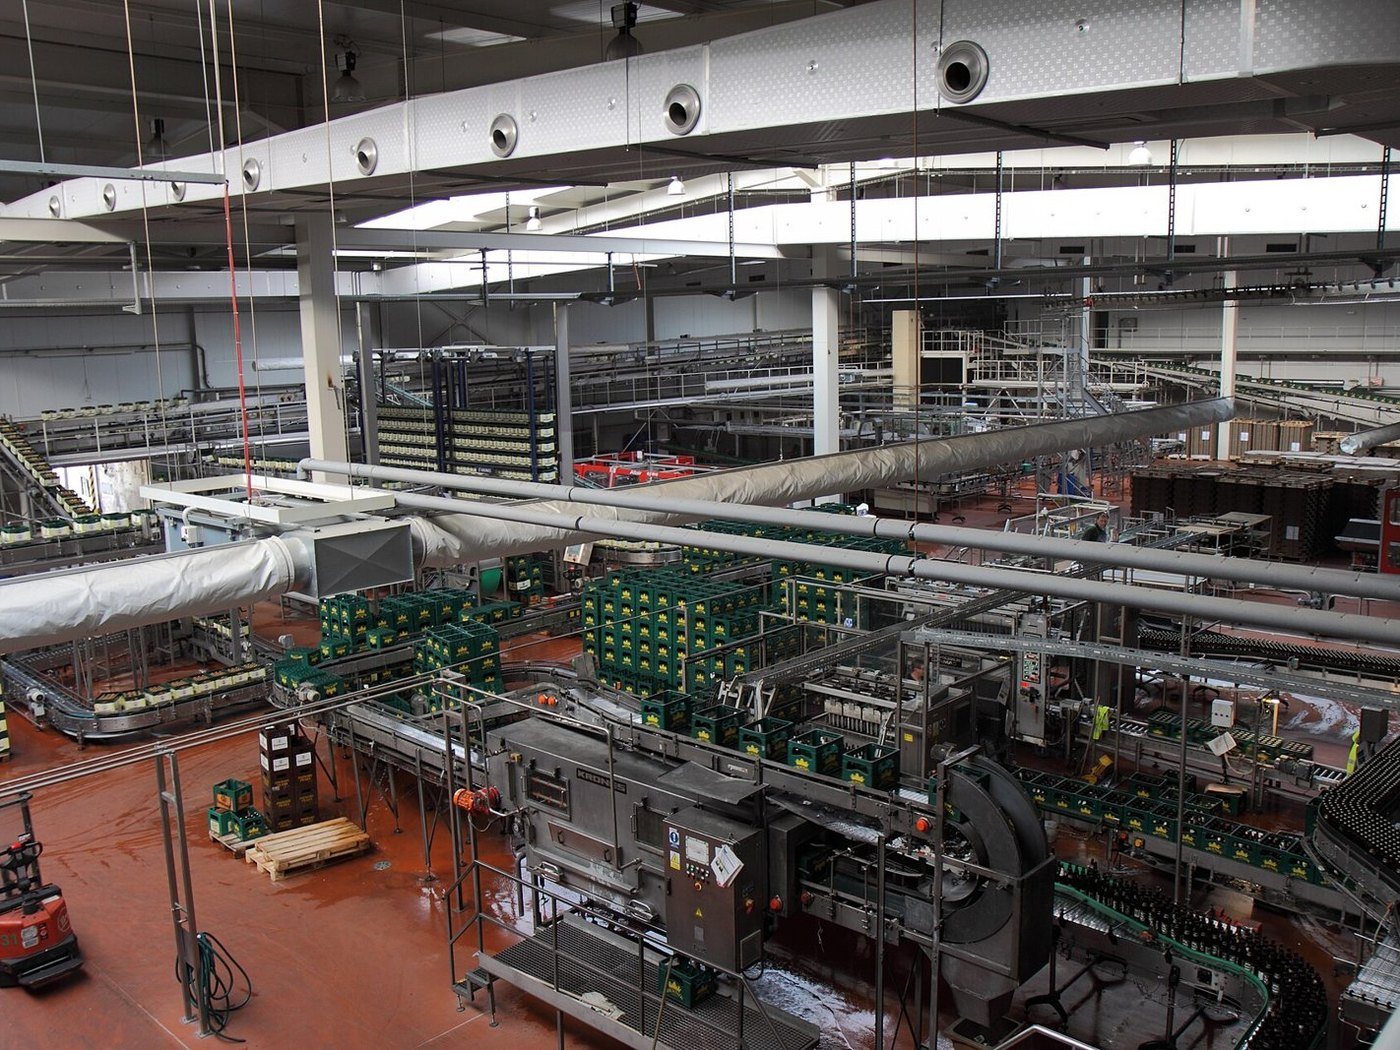
- What You Are Seeing
- Bottles run through a high-speed filler on a conveyor.
- Process lines are fixed-rate, so uptime and changeovers drive output.
- In The Primer
- Part 1 · 1.6 Types of production
Where: Staropramen brewery, Prague · Photo: Wikimedia Commons, Petr Kadlec, CC BY-SA 3.0
Gigafactory exterior, Nevada
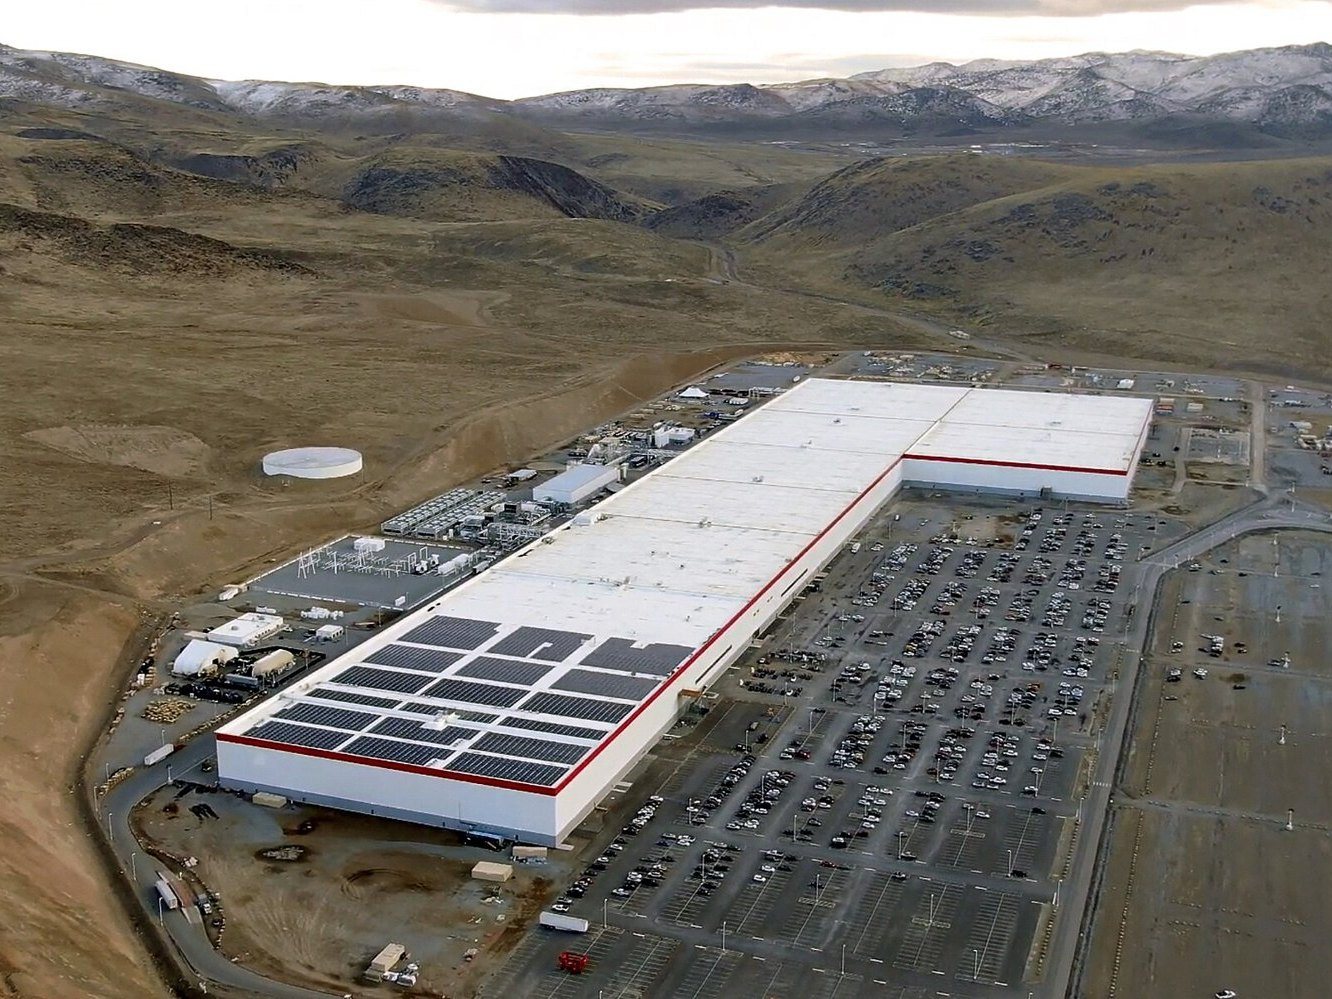
- What You Are Seeing
- Exterior of a battery gigafactory building.
- Megaprojects span millions of square feet and take years to build.
- In The Primer
- Part 3 · 3.4 Gigafactories and megaprojects
Where: Tesla Gigafactory 1, Nevada · Photo: Wikimedia Commons, Smnt, CC BY-SA 4.0
CNC vertical machining center
- What You Are Seeing
- A CNC mill cuts metal parts from programmed toolpaths.
- CNC machining sets the precision baseline for metal parts.
- In The Primer
- Part 4 · 4.3 Machining and CNC
Where: Haas CNC machining center · Photo: Wikimedia Commons, Psychlist1972, CC BY 2.0
Robot tending a CNC machine
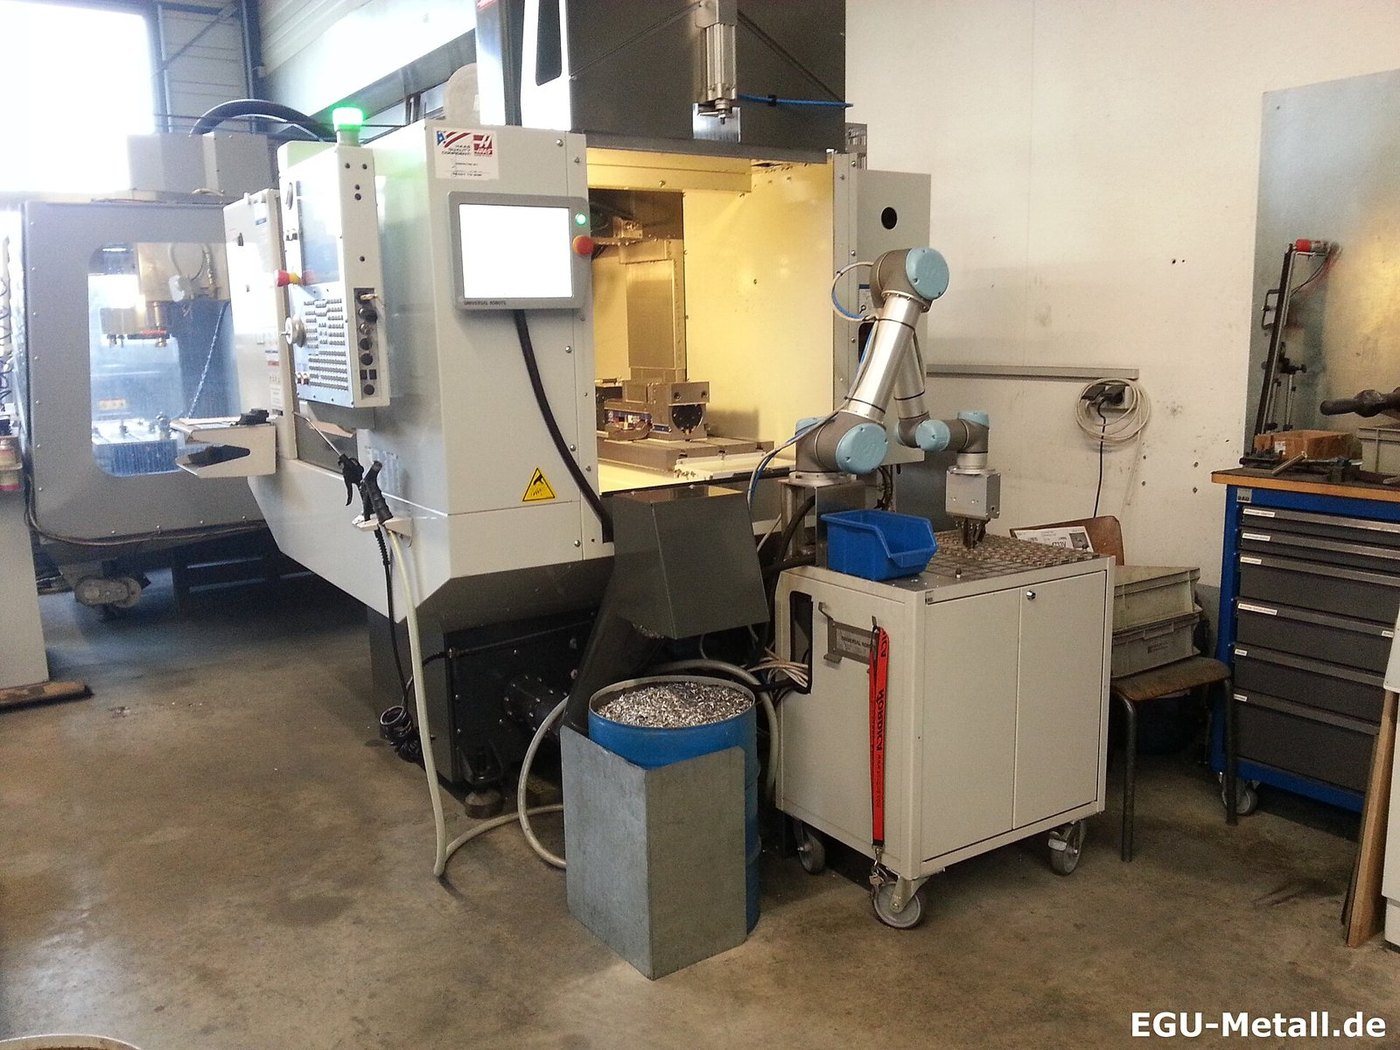
- What You Are Seeing
- A robot loads and unloads a CNC machine.
- Machine tending frees operators and keeps spindles running.
- In The Primer
- Part 5 · 5.14 Assembly, screwdriving, machine tending
Where: EGU-Metall, Germany · Photo: Wikimedia Commons, EGU-Metall, CC BY-SA 3.0
High-pressure die casting bay
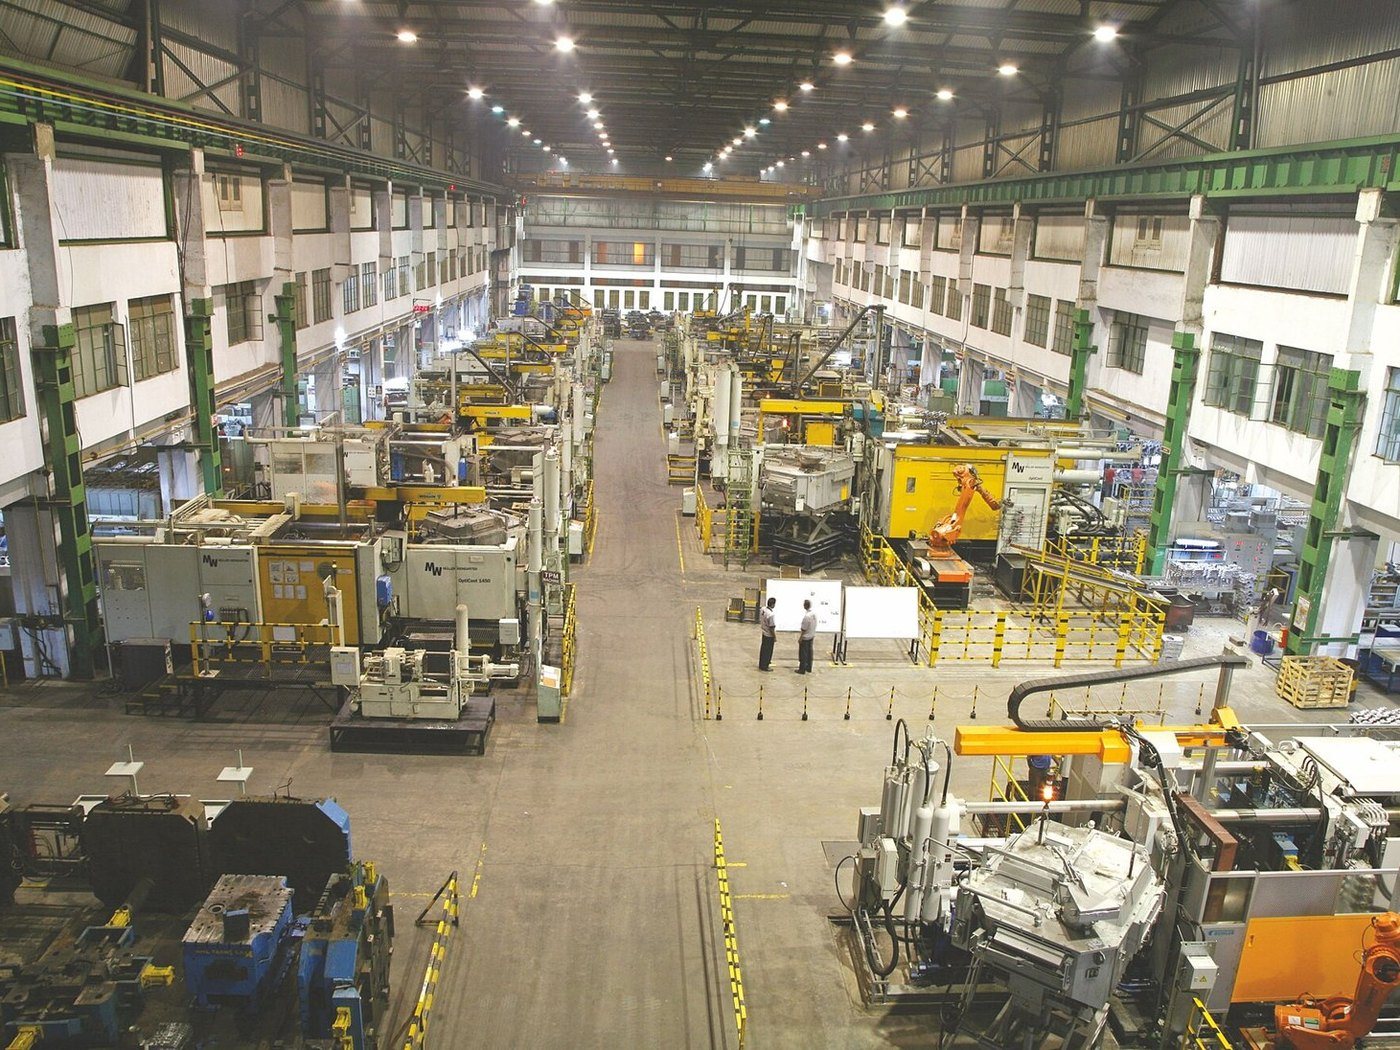
- What You Are Seeing
- Die casting machines shape molten metal into parts.
- Casting makes complex parts in volume at low unit cost.
- In The Primer
- Part 4 · 4.4 Casting, forging, stamping and forming
Where: Die casting plant · Photo: Wikimedia Commons, Mohsina Faiz, CC BY-SA 4.0
Pouring molten iron in a foundry
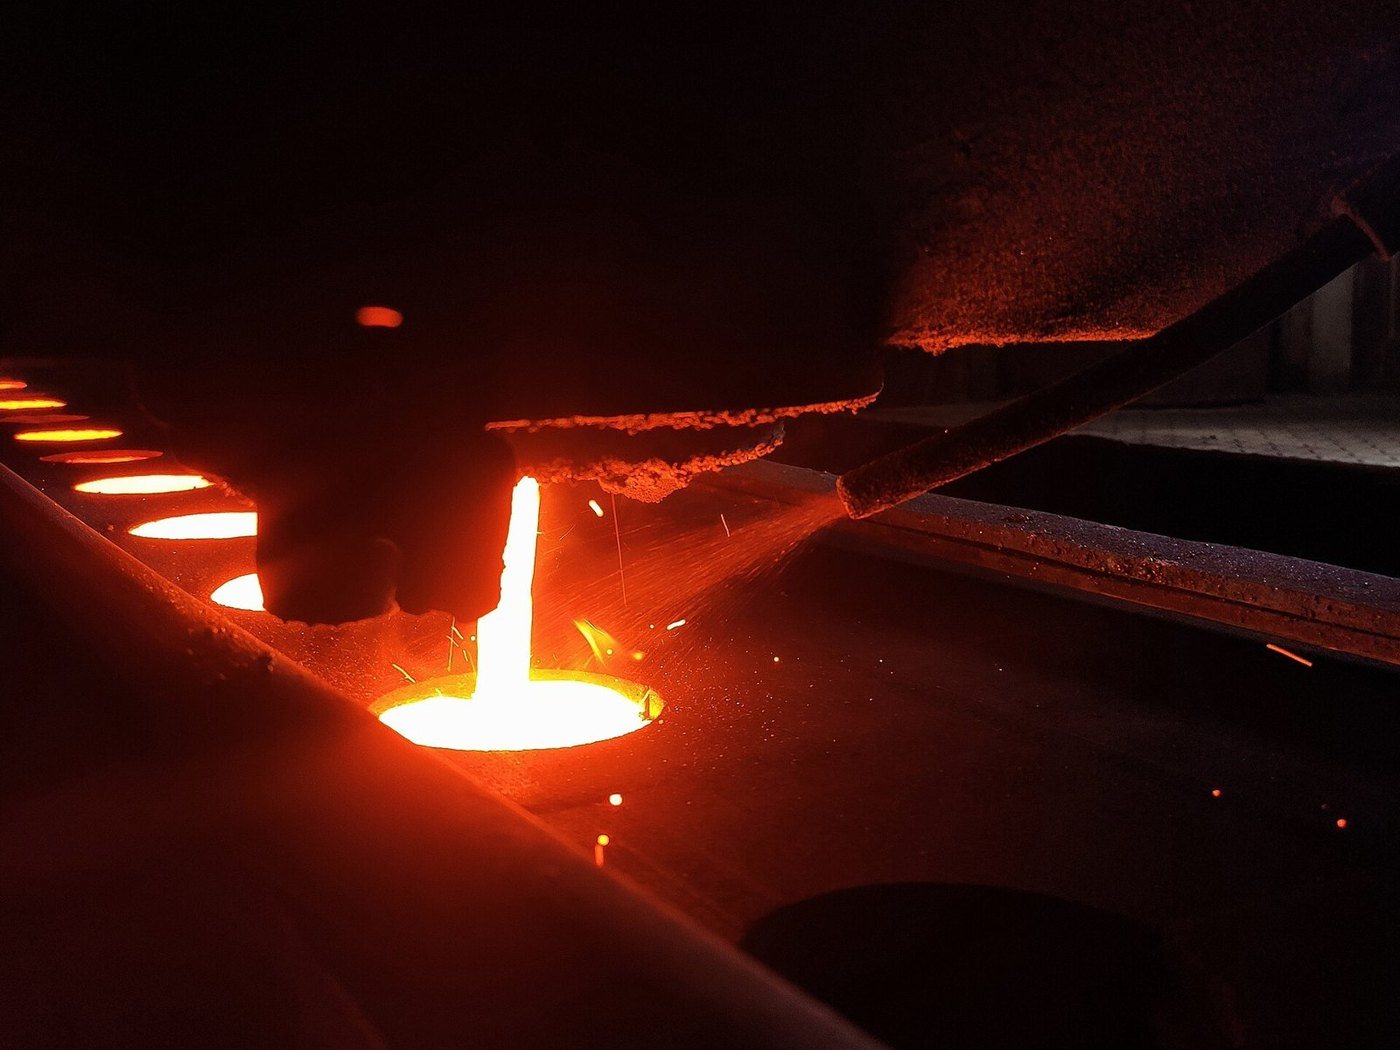
- What You Are Seeing
- Molten cast iron is poured into a sand mold.
- Foundry work is hot and hazardous, a candidate for automation.
- In The Primer
- Part 4 · 4.4 Casting, forging, stamping and forming
Where: Foundry, Bangladesh · Photo: Wikimedia Commons, Sm faysal, CC BY-SA 4.0
Metal 3D printing lab
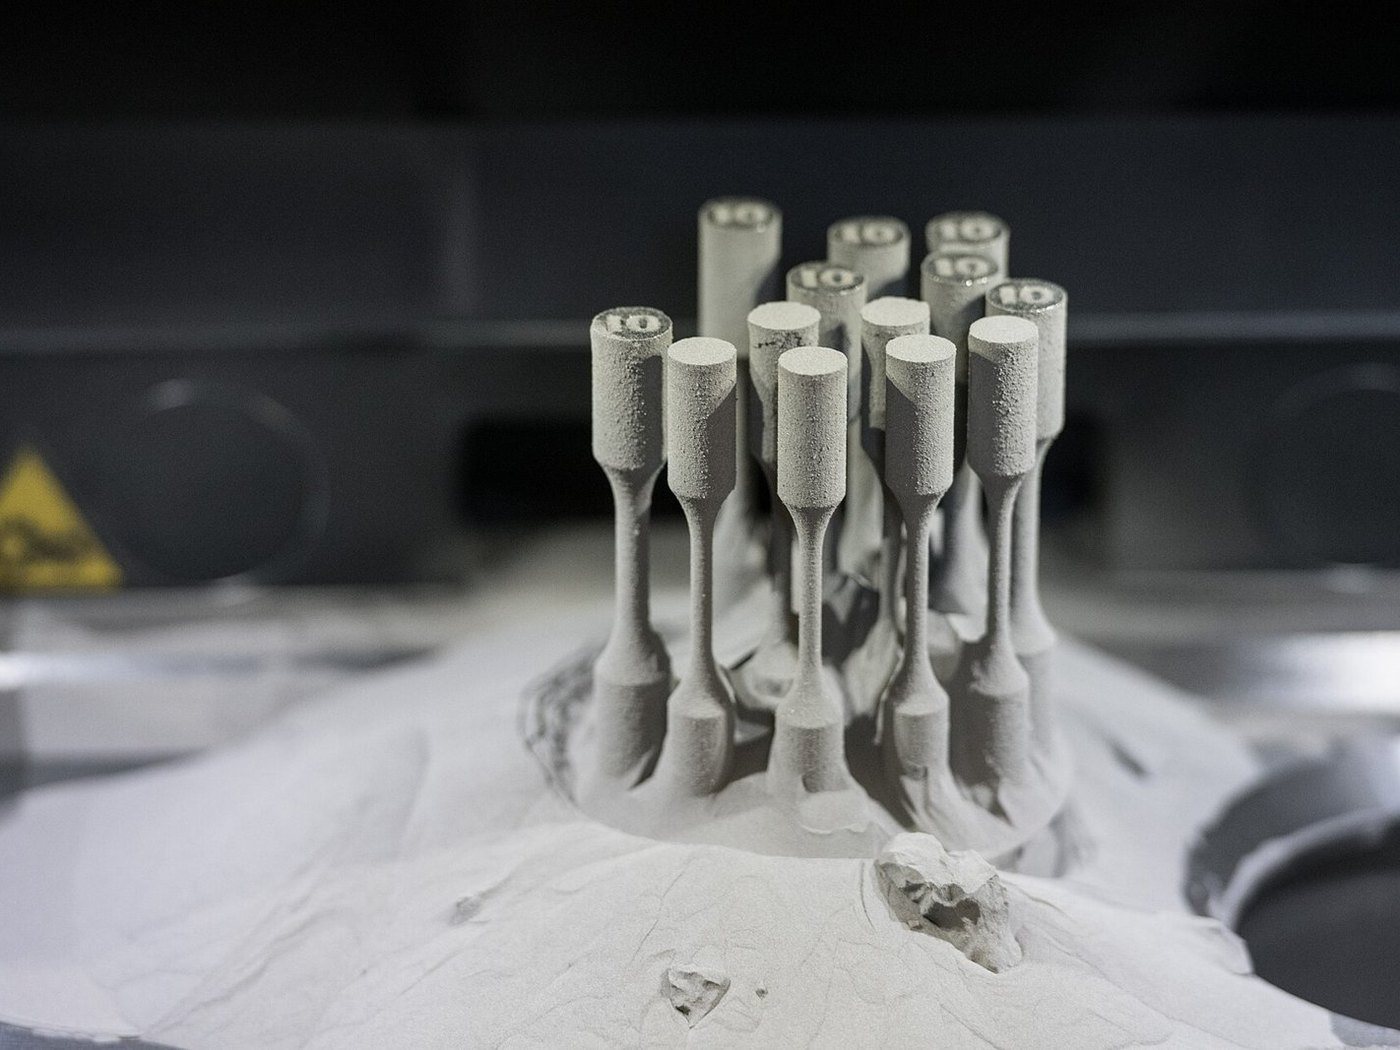
- What You Are Seeing
- An additive manufacturing machine builds parts layer by layer.
- Additive suits complex, low-volume parts without tooling.
- In The Primer
- Part 4 · 4.7 Additive manufacturing
Where: FZU, Czech Republic · Photo: Wikimedia Commons, René Volfík, CC BY-SA 4.0
FANUC six-axis welding robots
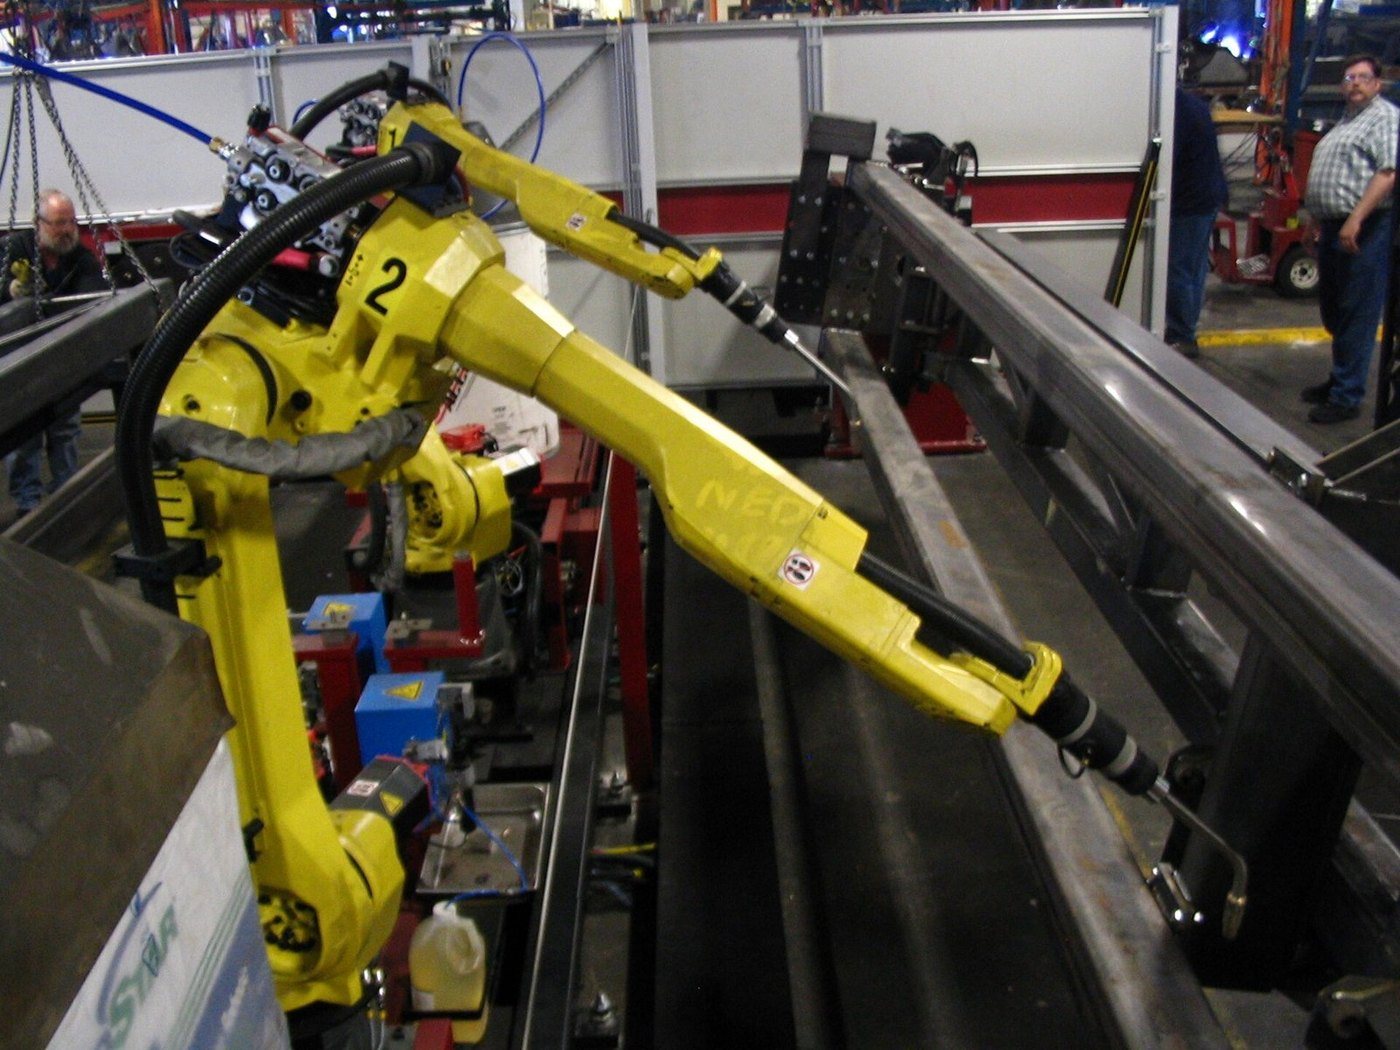
- What You Are Seeing
- Six-axis arms welding a workpiece in a cell.
- Arc welding is a mature, high-volume robot application.
- In The Primer
- Part 5 · 5.13 Application: welding
Where: FANUC welding robot cell · Photo: Wikimedia Commons, Phasmatisnox, CC BY 3.0
Car body shop robots
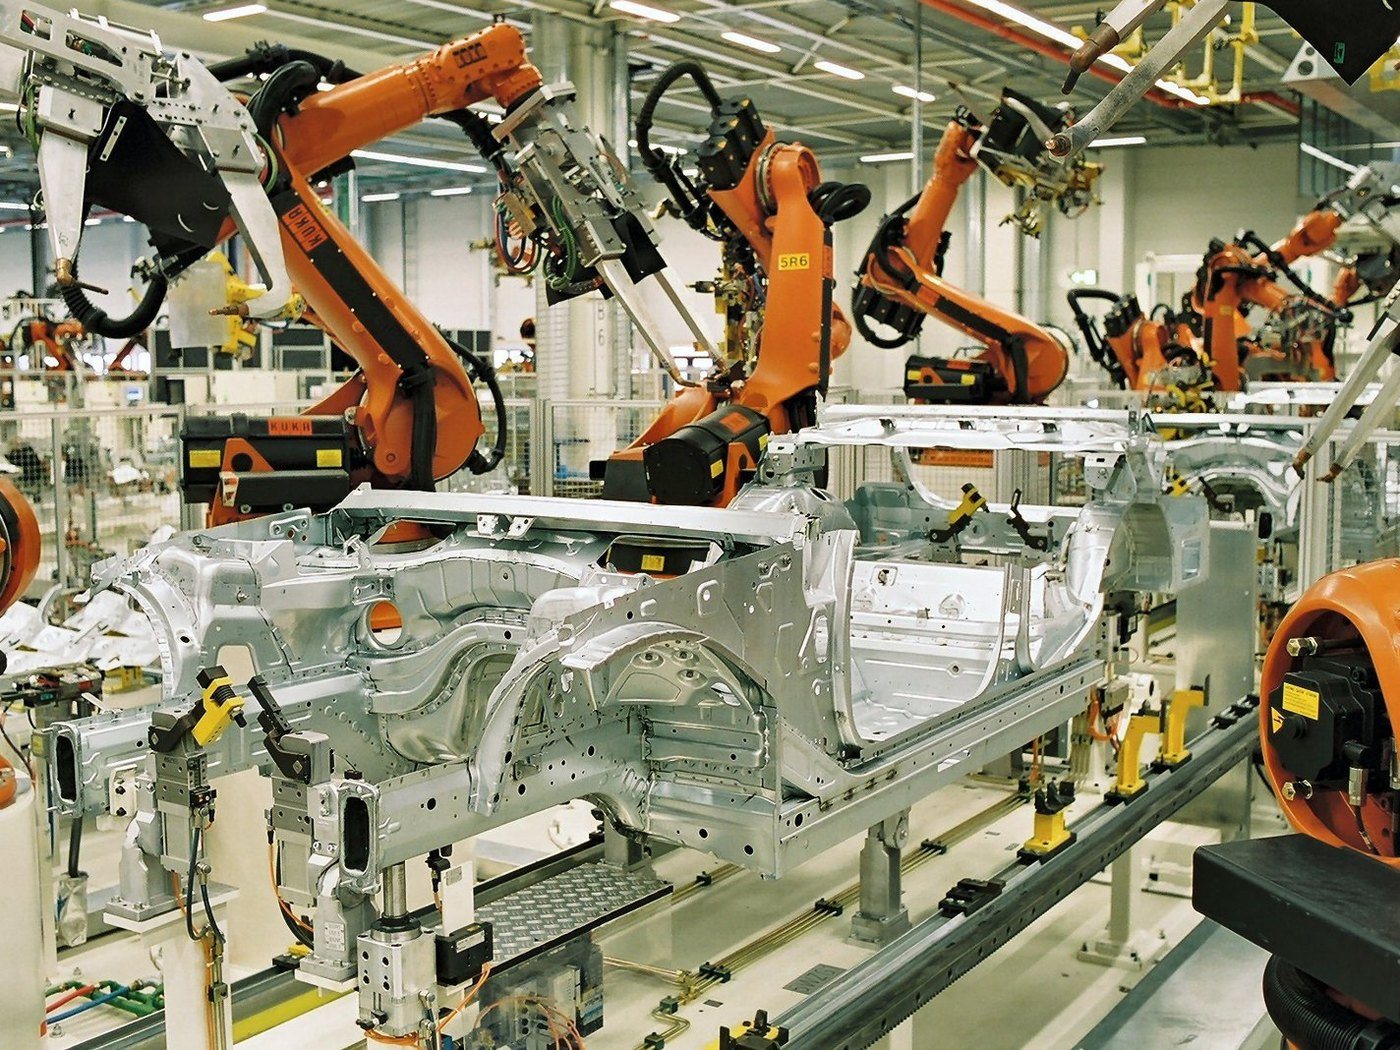
- What You Are Seeing
- Robots join body panels in a body-in-white line.
- Body shops are among the most automated areas of a car plant.
- In The Primer
- Part 4 · 4.5 Welding and joining
Where: BMW Plant Leipzig · Photo: Wikimedia Commons, BMW Werk Leipzig, CC BY-SA 2.0 de
Reference
Glossary, key numbers, organizations and sources.
Glossary of key terms (0–9–F).
Term
Meaning
Term
Meaning
Cobot
Collaborative robot designed to work near people, usually without a safety fence.
5S
Workplace method: sort, set in order, shine, standardize, sustain.
Automated guided vehicle: moves loads along fixed guidance such as wire, tape or laser targets.
Cpk
Process capability index: how well a process output fits inside its specification limits.
Autonomous mobile robot: navigates by onboard sensing and maps, no added floor guides.
Cycle time
Time to complete one unit at a single step, from start to finish.
Andon
Visual or audible signal that flags a problem on the line so work can stop and be fixed.
Delta robot
Light parallel-arm robot with very fast picking, common in food and packaging.
Digital thread
Connected data trail linking a product's design, production and service records.
Automated storage and retrieval system: machines that place and pull loads from racking.
Batch production
Making a limited quantity of one product, then changing over to the next product.
Digital twin
Live virtual model of a machine, line or plant, fed by data from the real asset.
Bill of materials: the list of parts, materials and quantities needed to build a product.
Six Sigma steps: define, measure, analyze, improve, control.
Bottleneck
The step with the lowest capacity, which sets the output of the whole line.
Degrees of freedom: the number of independent axes of motion a robot has.
Computer-aided design: software for drawing and modeling parts and assemblies.
Downtime
Scheduled or unscheduled time when equipment is not producing.
Electronics manufacturing services: contract maker that builds products for other brands.
Computer-aided manufacturing: software that turns CAD models into machine tool paths.
End effector
Tool at the end of a robot arm, such as a gripper, welder or suction cup.
Cartesian robot
Robot that moves along straight X, Y and Z axes, also called a gantry robot.
Enterprise resource planning: system that runs orders, inventory, purchasing and finance.
Changeover
Time and work to switch a machine or line from one product to another.
Factory acceptance test: buyer checks equipment at the supplier's site before shipment.
Coordinate measuring machine: probes a part to check dimensions against its drawing.
Fieldbus
Digital network linking controllers with field devices such as sensors and drives.
Computer numerical control: a computer drives a machine tool along programmed paths.
Glossary of key terms (F–P).
Term
Meaning
Term
Meaning
Failure mode and effects analysis: ranks how a design or process could fail.
Human-machine interface: the screen or panel an operator uses to monitor and control a machine.
IIoT
Industrial Internet of Things: networked sensors and machines that stream plant data.
Standard for linking business systems with plant control; defines levels 0 to 4.
Kaizen
Continuous improvement through small, frequent changes led by the people doing the work.
Kitting
Grouping all parts for one assembly into a single set before they reach the line.
Light curtain
Optical sensor wall that stops a machine when a person breaks the beam.
Manufacturing execution system: tracks and controls work orders on the plant floor.
Maintenance, repair and operations: supplies and spares that keep a plant running.
Mean time between failures: average run time between breakdowns of repairable equipment.
Muda
Japanese for waste: any activity that consumes resources without adding value.
Original equipment manufacturer: company that designs and sells the finished product.
Open, secure data exchange standard between machines, controllers and software.
OT
Operational technology: hardware and software that monitor and control physical processes.
Programmable logic controller: rugged industrial computer that runs machine logic.
Lockout/tagout
Procedure that isolates and locks energy sources before servicing a machine.
Gemba
Japanese for the real place: the shop floor where value is made.
Inverse kinematics
Math that finds the joint angles a robot needs to reach a target pose.
Mean time to repair: average time to restore equipment after a failure.
Jidoka
Built-in quality: machines stop themselves when they detect a defect.
Overall equipment effectiveness: availability x performance x quality.
Just-in-time: parts arrive when needed, keeping inventory low.
Kanban
Pull signal, often a card or bin, that triggers replenishment of parts.
Lead time
Total time from placing an order to receiving the finished product.
Payload
Maximum weight a robot can carry at its wrist, including the end effector.
Lean
Method of removing waste to deliver more value with fewer resources.
Poka-yoke
Mistake-proofing: a design feature that prevents or flags a human error.
Production part approval process: proof that a supplier can make parts to spec.
Glossary of key terms (P–Y).
Term
Meaning
Term
Meaning
Predictive maintenance
Servicing equipment based on condition data instead of a fixed calendar.
Process manufacturing
Making goods by mixing or reacting materials in bulk, as in chemicals or food.
RaaS
Robots-as-a-service: paying a recurring fee to use robots instead of buying them.
Robot Operating System: open-source software framework for building robot applications.
Safety PLC
Controller certified to run safety functions such as emergency stops and interlocks.
Supervisory control and data acquisition: software to monitor and control a wide process.
Selective compliance articulated robot arm: fast, rigid in Z, used for small assembly.
Six Sigma
Data-driven method to cut variation; target is 3.4 defects per million opportunities.
Single-minute exchange of die: methods to cut changeovers to under ten minutes.
Statistical process control: charts that track process variation to catch drift early.
Total effective equipment performance: OEE measured against all calendar time.
Tier 1
Supplier that sells directly to the OEM, often delivering whole systems or modules.
Total productive maintenance: operators and maintainers jointly keep equipment reliable.
Value stream map
Diagram of every step and delay from raw material to customer, used to find waste.
Work in process: partly finished goods between raw material and finished product.
Takt time
Available production time divided by customer demand; the pace of sales.
Reach
Maximum distance a robot arm can extend from its base to its working point.
Tool center point: the reference point at the tip of a robot's tool.
Repeatability
How closely a robot returns to the same taught point on repeated moves.
Teach pendant
Handheld device used to program, jog and test a robot.
Throughput
Number of good units a line or plant produces per unit of time.
Site acceptance test: buyer checks equipment after installation at its own plant.
Servo
Motor with feedback that controls position, speed and torque precisely.
Vision system
Cameras and software that let machines inspect parts or guide robots.
Singularity
Arm pose where joints line up and the robot loses control of some motions.
Work cell
Group of machines and tools arranged together to make a family of parts.
Stock keeping unit: a unique code for each distinct product or variant.
Yield
Share of units that come out good; first pass yield excludes any rework.
Key numbers and rules of thumb.
Indicative figures for fast reference in discussion. See the relevant section for sources and context.
Topic
Rule of thumb
Topic
Rule of thumb
World-class OEE
About 85%, e.g. 90% availability x 95% performance x 99.9% quality.
Typical plant OEE
Most plants run roughly 40-60% OEE.
Takt time
Net available time / customer demand (400 min / 400 units = 1 min).
Six Sigma
3.4 defects per million opportunities, with a 1.5-sigma shift allowed.
Robots installed 2025
603,307 industrial robots worldwide; about 5M in operation (IFR WR 2026).
China share of robots
354,000 robots in 2025, 59% of the world total (IFR WR 2026).
U.S. installs 2025
About 38,400 industrial robots, up 12%; now #2 behind China (IFR WR 2026).
Robot density 2023
World average 162 robots per 10,000 workers; U.S. 295 (IFR).
Density leaders 2023
Korea 1,012; Singapore 770; China 470; Germany 429; Japan 419.
Cobot share
10.5% of industrial robots installed in 2023 (IFR).
Cobot payload ceiling
Top models carry about 30 kg (UR30: 35 kg extended).
Cobot installed cost
Arm $25K-$75K; installed with tooling $40K-$150K (vendor estimate).
Industrial arm cost
Arm $50K-$200K; installed $150K-$500K (vendor estimate).
Integration vs robot
Integration can double the robot price; hidden costs add 50-100%.
Typical payback
About 18-36 months for a robot cell (vendor estimate).
Compressed air
About 10% of U.S. manufacturing electricity; leak repair saves 10-15%.
Materials share
61% of shipments in food, 66% in transport equipment (2021).
U.S. manufacturing
9.4% of GDP ($3.0T, Q2 2026); 12.65M jobs, $36.92/hr (Sep 2026).
Labor gap to 2033
3.8M hires needed; 1.9M could go unfilled (Deloitte, MI 2024).
Unplanned downtime
Large auto plant loses about $2.3M per hour (Siemens 2024).
The organizations that shape the industry. (1 of 2)
Standards bodies, trade associations and research groups worth knowing.
| Organization | What it does | Type |
|---|---|---|
| IFR | Publishes World Robotics installs and robot density data | Statistics body |
| A3 (Advancing Automation) | Robotics, vision, motion; formed 2021 from RIA, AIA, MCMA | Trade association |
| NAM | Voice of U.S. manufacturers since 1895; policy and advocacy | Trade association |
| Manufacturing Institute | NAM affiliate for workforce, skills and credentials | Nonprofit |
| NIST MEP | Advisers to small and mid-size U.S. manufacturers | Government program |
| ISO | Sets international standards, incl. ISO 10218 robot safety | Standards body |
| ANSI | Coordinates U.S. standards system; not itself a standards writer | Standards body |
| ISA | Automation professionals; ISA-95, ISA-88, ISA/IEC 62443 | Professional body |
| OSHA | Sets and enforces U.S. workplace safety rules | Government agency |
The organizations that shape the industry. (2 of 2)
Standards bodies, trade associations and research groups worth knowing.
| Organization | What it does | Type |
|---|---|---|
| SME | Manufacturing engineers; events and certifications since 1932 | Professional body |
| ASQ | Quality professionals; founded 1946; Six Sigma training | Professional body |
| CESMII | DOE-funded smart manufacturing institute, founded 2016 | Federal institute |
| Industry IoT Consortium (IIC) | Trustworthy IoT adoption; OMG program, formerly Industrial Internet | Consortium |
| OPC Foundation | Maintains OPC UA data exchange standard | Standards body |
| ODVA | EtherNet/IP and CIP specifications; conformance testing | Trade association |
| PI (PROFIBUS and PROFINET) | Maintains PROFIBUS, PROFINET and IO-Link support; Karlsruhe | Trade association |
| VDMA Robotics + Automation | German machinery group's robotics, vision and automation unit | Trade association |
| AMT | U.S. machine tool builders since 1902; runs IMTS, MTConnect | Trade association |
Sources.
Public sources behind the figures in this primer. Products and photographs belong to their owners.
- 2025 employment)
- A3 (2025 and H1 2025 reports)
- A3 (2026)
- A3 (Feb 2026)
- A3 (Feb, Apr and Oct 2026)
- A3 ISO 10218 FAQ and standards page (2025)
- Abb (2025)
- ABB IRB 360 and FlexPicker releases
- Accenture and Schaeffler (Apr 2025)
- Agility (Oct 2026)
- Amazon (2024, updated 2026)
- Amazon (2026)
- Apptronik
- Area Development (2026)
- Area Development, Q1 and Q2 2026
- ASQ cost-of-quality rule of thumb
- Atomgigs illustrative model
- Atomgigs operating model
- Atomgigs pilot design
- Atomgigs synthesis of common plant structures
- Atomgigs synthesis of standard plant-planning practice
- Automated Warehouse (2025-26)
- Automotive Manufacturing Solutions on Hyundai Metaplant America (2026)
- AWS Foundation/Lightcast (2025)
- BEA and Federal Reserve G.17 via FRED (Sep 2026)
- BEA and NAM (Q2 2026)
- BEA GDP by industry via FRED (2025)
- BEA GDP by state (2025)
- BEA GDP by state, manufacturing (2025)
- BEA via FRED (2025)
- Bls (2024)
- BLS (Sep 2026)
- BLS average hourly earnings (Sep 2026)
- BLS Census of Fatal Occupational Injuries (2024)
- BLS CES (Sep 2026)
- BLS CES (Sep 2026), JOLTS (2025), OOH (2026)
- BLS CES by state (Sep 2026)
- BLS Current Employment Statistics (Sep 2026)
- BLS JOLTS (Sep 2026)
- BLS JOLTS and CES (Sep 2026)
- BLS Occupational Outlook Handbook (May 2025 data
- BLS Occupational Outlook Handbook (May 2025 median pay)
- BLS OOH (May 2025)
- BLS Survey of Occupational Injuries and Illnesses (2024)
- BLS via FRED (Sep 2026)
- BMW (2024)
- BMW Group (2023, 2025)
- BMW Group (2025)
- Boeing Everett per Wikipedia (2026)
- Celestica 2024)
- cell split illustrative
- Census (2026)
- Census Annual Survey of Manufactures 2021 ($785B payroll, $6.1T shipments)
- Census Bureau (2025)
- Census construction spending via FRED (Sep 2026)
- Census Quarterly Financial Report, Q4 2025
- Census via FRED (Sep 2026)
- Chalmers studies (1998, 2016)
- Common industry framing of digital twin maturity
- company announcements and filings (2025-26)
- Company annual reports (Foxconn 2025
- company filings and websites for examples
- company filings and Wikipedia summaries
- company releases
- company releases (Toyota 2025, Hyundai, TSMC 2025)
- company reports
- CSIA (2026). The 1x-3x range is an industry rule of thumb
- Cushman & Wakefield (Oct 2026)
- D Business on Universal Robots (2022)
- Damodaran, NYU Stern, U.S. margins (Jan 2026)
- Dassault
- Deloitte (2024)
- Deloitte and Manufacturing Institute (Apr 2024)
- Deloitte and The Manufacturing Institute (Apr 2024)
- DOE compressed air guidance via Reliabilityweb (2026)
- DOE O&M Best Practices Guide via Reliable Plant (2026)
Atomgigs value proposition
The whole Atomgigs offer in brief: the model, the robots, services, the site pod and the commercial model.
We bring humans and machines together.
Atomgigs is not just robots. It is every kind of physical AI, put to work on your build and kept running.
Atomgigs brings humans and machines together to scale up a build and stay to operate it: robots, drones, IoT devices, digital twins and complex machinery, run as one crew with machines taking more of the load as they prove themselves.
Atoms
The physical world: sites, machines and materials.
Gigs
Jobs done. Defined work, delivered in focused engagements.
Atomgigs
Physical AI, delivered as jobs done.
Project owners
Work built and running now, with more robots over time.
Manufacturers and OEMs
A route from the factory to the field and a paying customer.
Investors
Eyes and expertise on your physical AI bets.
- Manufacturers and OEMs make the machines. Project owners need the build done and the site operating.
- Atomgigs connects the two, and everyone with capital at stake.
Four forces make this the moment.
Physical projects are growing faster than the teams that build and operate them, and robots are arriving.
Demand is rising
- AI campuses, transit and energy programs are scaling up
- Agility reports $300M+ in booked multi-year orders
- SoftBank launches Roze AI to build data centers with autonomous robots
Labor is short
- About one in five electricians is over 55
- Most 2026 demand comes from retirements, not new activity
- An apprentice who starts in 2026 is licensed around 2031
- Hardest roles to fill: electrician, mechanic, HVAC
Capital is flowing
- Over $8.7B of humanoid venture funding in 2026, about two-thirds to Chinese firms
- Record $15B robotics startup funding in 2025, above the 2021 peak
- Agility goes public by SPAC at about $2.5B
- Humanoid market forecast at $38B by 2035
Robots are ready
- Toyota Canada: seven Agility humanoids on a production line
- Tilbury Douglas (UK): a humanoid on a construction site
- BMW: Figure humanoids at Spartanburg
- Dusty and Spot: layout and inspection on sites
- 542,000 industrial arms installed in 2024
Machines are arriving. The people and process to deploy them are the scarce part.
Robot makers sell machines. Owners need finished work.
A robot on a pallet is not a productive crew. Between the factory and the finished site sits a layer nobody owns.
Machines
- Robots, as units or per-hour service
- Focused on product, funding and scale
- Limited field and site-integration teams
- Support for the machine, not the project
- Deployment left to the buyer
Who does all of this?
- Selects and sources the right robot
- Integrates it into the site workflow
- Trains, supervises and keeps it running
- Staffs the people working beside it
- Answers when the schedule slips
Outcomes
- Work finished on schedule and to spec
- Skilled people they cannot find
- Safety and compliance on live sites
- One responsible party, not five vendors
- A way to start small and scale
Atomgigs fills the gap: the integrator that scales your build and stays to operate, turning robots and labor into a delivered outcome.
One hybrid workforce, delivered as a service.
We combine robots, specialized labor and site leadership to scale your build, then operate it.
We are
- An integrator of robots and people.
- A direct sourcer of robots from their manufacturers, helping deploy them on your project.
- A source of vetted specialized labor.
- The lead on site, with a designated human manager for each robot.
- An advisor to robot makers and investors.
We are not
- A robot manufacturer.
- A staffing agency alone.
- A general contractor of record.
- Tied to any one robot brand: we match the robot to the task.
You get
- One team and one contract.
- Robots where they work, people where they must be.
- A start with people that shifts as robots mature.
- Pay for capacity and outcomes, not hardware.
Robots from their makers. People from our network. One team on site.
Source, staff, integrate, scale and operate.
We assemble everything to scale your build and operate with people and robots, and own the result.
Source the robots
We contract robots directly with their makers, across many makers and models, light to heavy. We match the robot to the task, not the brand.
Bring the people
Vetted skilled labor and supervisors from our partners, trained to work beside robots and ready to start fast.
Put them to work together
Site mapping, task design, tooling, safety and fleet operations, run by one small pod, with a designated human manager assigned to each robot.
Scale and operate
One team, one contract, weekly reporting. The mix shifts toward robots as they prove safe, reliable and cheaper.
Robots profiled in depth
Phases from human crews to robot-led sites
Contract and one team on site
Humans in the lead, physical AI in the loop. A small senior pod runs every site, with robots and crews behind it.
Robots take more of the load as they prove out.
Customers get capacity from day one; the robot share grows as it proves safe, reliable and cheaper.
Human crews
- Specialized trades placed fast
- Labor partners vetted
- Safety and quality managed
- Robots limited to pilots
Robot-assisted
- Robots take repetitive tasks
- Layout, drilling, tying, hauling
- Humans supervise and finish
- Safety cases proven
Hybrid crews
- Mixed crews by design
- Robots do dull and dangerous work
- Humans do judgment work
- Fleet orchestration
Robot-led
- Robots at scale across sites
- Humans as supervisors and technicians
- Fewer people, higher skill
- Robots handle routine site operations
We never move faster than safety permits.
People lead the work; robots handle defined tasks.
"Humans in the lead, physical AI in the loop" is the operating model: people set scope, sequence and quality.
| Mode | Human role | Robot role | Typical work |
|---|---|---|---|
| Cooperation | Same area, sequential tasks | Does the step before or after the person | Robot moves materials to a human-run station |
| Shared task | Hands-on with the robot | Responds to human motion and force | People pick or fit; robots carry |
| Operator-directed | Directs from a tablet or remote; does touch-up | Does the bulk repetitive work | Finishing and drilling |
| Supervised autonomy | Sets the job, monitors, resolves exceptions | Runs the mission on its own | Layout from a design model; site rounds |
| Teleoperation | Takes control for exceptions or whole tasks | Executes motion; may be partly human-driven | Delivery and general-purpose robots |
| Fleet supervision | One person oversees many robots | Fleets coordinate themselves | Many robots under one supervisor |
RISING MATURITY
In construction, most deployed systems today are operator-directed or supervised autonomy.
These jobs cover what robots do on site today.
Atomgigs knows the commercially viable robots and matches each to the task.
| Function | Typical robots | Typical sites | Status today |
|---|---|---|---|
| Material handling | AMRs (Locus), forklift AGVs (Seegrid), tuggers, truck unloaders (Stretch) | Warehouses, factories, laydown yards | Scaled |
| Welding and assembly | Industrial arms and cobots (FANUC, Universal Robots) | Factories, prefab shops | Scaled |
| Picking and sortation | Arm plus vision systems (Dexterity) | Fulfillment centers | Commercial |
| Cleaning and security | Floor scrubbers (Avidbots, Brain Corp); patrol robots (Knightscope, Spot) | Warehouses, campuses, data centers | Commercial |
| Inspection and monitoring | Quadrupeds (Spot, ANYmal), drones (Skydio), wall crawlers | Plants, vessels, data center halls | Commercial |
| Layout and marking | Layout-printing robots (Dusty, Rugged, HP SitePrint) | Construction floors | Commercial and early |
| Drilling and anchoring | Ceiling-drilling robots (Hilti Jaibot) | Construction MEP work | Commercial |
| Earthmoving and piling | Autonomous excavators, haulers, pile drivers (Built RPD 35, Bedrock) | Civil, solar and large sites | Early commercial |
| Finishing and rebar | Drywall and wall robots (Canvas, Okibo); rebar tyers (TyBOT) | Interiors, bridge decks | Early and commercial |
| General manipulation | Humanoids (Digit, Figure, Apollo, Atlas) and mobile manipulators | Pilots across many sites | Pilot |
Four sectors, one playbook.
A partial list of the robots we match to each sector, with the same pod and playbook in each.
Data centers
Hyperscalers, colos, developers, GCs and EPCs.
ROBOTS
- Rack-side remote hands: Watney, ABB
- Fiber cross-connect: Telescent
- Inspection: Spot, ANYmal, Skydio
- Cleaning and security: Avidbots, Knightscope
- Materials and unloading: Locus, Stretch
- Humanoids: Digit, Figure
Construction
Commercial, industrial and civil builders.
ROBOTS
- Layout printing: Dusty, Rugged, HP SitePrint
- Drilling: Hilti Jaibot, DEWALT
- Piling and excavation: Built RPD 35, Bedrock
- Drywall finishing: Canvas, Okibo
- Rebar tying: TyBOT
- Inspection: Spot, Skydio
Transit
Transit agencies, rail and highway owners and contractors.
ROBOTS
- Track and tunnel inspection: Spot, ANYmal, Skydio
- Civil layout: Civ Robotics
- Piling and earthmoving: Built RPD 35, Bedrock
- Bridge-deck rebar tying: TyBOT
- Station cleaning: Avidbots, Brain Corp
- Depot logistics: Locus, Seegrid
Oil and gas
Operators, EPCs and service firms.
ROBOTS
- Legged inspection: Spot, ANYmal
- Drone and crawler inspection: Skydio
- Welding cells: FANUC, Universal Robots
- Site patrol: Knightscope, Spot
- Yard logistics: tuggers, Seegrid
- Hazardous-site humanoids: pilots
Not just the robots.
Atomgigs coordinates the equipment, automation and digital twins your build needs, and operates them.
Equipment coordinated
We coordinate the implementation of large, complex systems, working with original equipment manufacturers (OEMs), distributors and end users.
- Data center power: transformers, switchgear, generators, UPS
- Cooling: chillers and liquid cooling
- Large-scale automation products, such as transducers and control systems
- Specifications, submittals and factory acceptance tests
- Heavy-haul delivery, rigging, pads and laydown
- Installation, utility interconnection and commissioning
- One team coordinating OEMs, distributors and the end user
Automation and IoT
Everything automation, from a single sensor to a full system.
- IoT sensors for power, temperature, flow, leaks and vibration
- Controllers, gateways and edge devices
- Building management, power monitoring and SCADA integration
- Open protocols, so many vendors work together
- Full automation systems, integrated and commissioned
- Network and cybersecurity design for site devices
- Feeds the site's digital twin
A live model of the site
A digital twin is a living digital copy of a site and everything installed on it.
- PLAN
- Model a data center or other project before breaking ground: layout, power, cooling, equipment fit and sequence of work.
- BUILD
- Update the model with as-built data and equipment submittals, then hand it to the owner.
- OPERATE
- Map the site and track each installed product
- Support operations and maintenance
- Keep service history, warranties and work orders
- Plan servicing and spares; add live sensor data
One idea, three buyers.
We serve three types of clients.
Project owners
- Who
- Data center, construction, transit, oil and gas, plant and logistics owners and their contractors
- Their Problem
- Need work done and skilled people; robots are not yet usable by them
- What Atomgigs Does
- Picks the right robots, plans the work, supplies the people and runs the hybrid crew
- Our Promise
- Finished work now, with more robots over time
Robot makers
- Who
- Robot manufacturers and startups
- Their Problem
- Machines are built, but few buyers can deploy them
- What Atomgigs Does
- Positions the robot, finds the right use cases and buyers, supports first deployments
- Our Promise
- A route from the factory to a paying customer
Investors
- Who
- Funds and owners with capital in robotics, data centers and property
- Their Problem
- Capital committed, with little in-house expertise to judge or steer it
- What Atomgigs Does
- Advises on investments, tracks portfolio companies, optional board seat
- Our Promise
- Eyes and expertise on your physical AI bets
Everything the hybrid workforce needs, plus advice.
Scale your build and stay to operate: buy the full package or pick the pieces.
- Robot sourcing
- Select and contract the right robots from multiple makers, on service or purchase terms, matched to the task and site.
- Specialized labor
- Vetted electricians, pipefitters, technicians and supervisors from labor partners, on demand and at scale.
- Integration and site engineering
- Fit robots into the workflow: site mapping, task design, tooling, networks, charging, staging and handoffs.
- Safety and compliance
- Safety cases, training, supervision and incident response for people and machines sharing a live site.
- Fleet operations
- Deployment, monitoring, maintenance and uptime, including remote operations support.
- Data and reporting
- Productivity, progress and safety data captured by the fleet and reported to owners weekly.
- Robot maker advisory
- Go-to-market and positioning for robot makers: use cases, buyers and first deployments.
- Investor advisory
- Diligence, portfolio tracking and board-level support for investors in physical AI.
One accountable team for the machines, the people and the result, from build to operations.
A pod, not a pyramid.
A small senior pod runs each site, from build to operations, with a human manager per robot.
Site Pod Lead
- Single point of contact
- Owns schedule and outcome
- Owner and GC interface
- Weekly reporting
Robotics Lead
- Chooses robots per task
- Runs integration and tooling
- Vendor coordination
- Fleet uptime
Skilled Crew
- Trades from labor partners
- Works beside robots
- Foreman on every shift
- Cross-trained on the fleet
Safety and Compliance
- Site safety plan
- Human-robot zoning
- Training and certification
- Stop-work authority
Remote Ops and Data
- Fleet monitoring
- Progress capture
- Owner dashboards
- Remote assist
Right-sized to scope, and scaled up or down as the work changes.
Start small. Pay for capacity and outcomes.
No capital outlay for robots and no long-term headcount. Scale up as results are proven.
Pilot
Pilot on site, with one defined scope.
- 4 to 8 week pilot
- Mixed crew with one or two robot tasks
- Agreed success metrics
- Fee based on our estimate, low commitment
Managed Crew
A hybrid crew on retainer, from build to operations.
- Monthly fee per crew or per robot
- Labor, robots and supervision
- Flex up or down on notice
- Weekly reporting on output and safety
Outcome-Based
Paid for work completed.
- Priced per unit of finished work
- Shared savings against baseline
- Multi-site master agreements
Advisory
Scoped engagements for expertise.
- Robot maker go-to-market support
- Investor diligence and portfolio tracking
- Board and advisor roles
- Scoped per engagement
Start with a pilot; move to a managed crew; shift to outcomes as the robots earn it.
Mavengigs: The Scale Up Guys
Consulting, Capital and Ventures
$20B+
M&A deal value
30+
Years consulting
50+
Companies scaled
$100M+
Business impact
Mavengigs Consulting
Mavengigs Capital
Mavengigs Ventures
- Strategic M&A, transformation and optimization
- Focused on the part of M&A that begins after everyone shakes hands
- Built for PE-backed and Fortune 500 teams
- An independent sponsor platform
- Family office strategy and management
- Funding and mentorship for founders we back
- Panmedical: digital health in India, run as CEO
- Atomgigs, Mavens Life and Mavens Health
Monty Pandey: Founder, CEO and driving force behind Atomgigs
Selected transactions, buy side and sell side
Core Expertise: 30+ years of management consulting in integration, divestiture, PMO and IMO. $20B M&A deal value, $100M business impact.
- 2018-present: Mavengigs: Consulting, Capital and Ventures
- 2004-2018: Founded Panvisage, CEO for 22 years
- 1998-2004: Oracle, led 14 enterprise programs
- 1994-96: Rolled out nationwide cell networks
- 1992-94: Car and truck design (CAD, CAM, CIM)
- 1989-91: B.E. Electrical and Electronics; designed robots (AGVs)
- Data Centers: Equinix
- E&C Companies: WSP, Jacobs, Halliburton, Fluor Daniel, Brown & Root
- Managed buildout of a manufacturing plant and a distribution center
GE Appliances / Haier
$5.6B
Readied for sale
Jacobs / CH2M
$3.3B
Integration
ITW Signode / Carlyle
$3.2B
Carve-out, then sale
AMLI / Morgan Stanley
$2.1B
Take-private
Fortune Brands / ACCO
$2B
Divestiture, integration
Equinix / Packet
$335M
Integration
Have a manufacturing project to scale up and operate with hands and machines?
Tell us about the site, the scope and the schedule. We will come back with a pilot proposal. Monty Pandey, CEO, [email protected], +1-310-694-4750, Los Angeles, California.